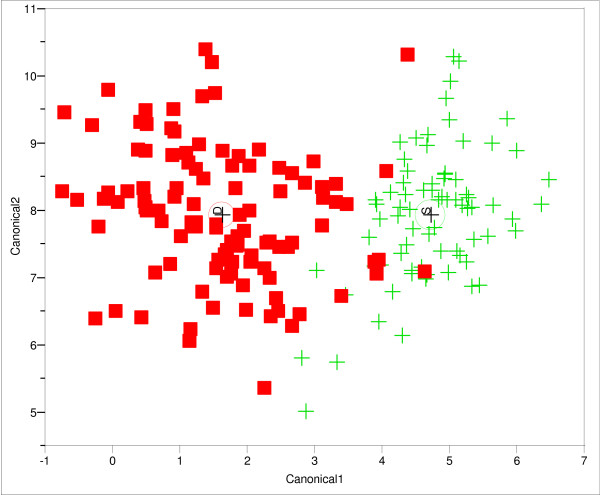
Figure 2.
Discriminant function analysis plot based on 14 morphological characters of E. flexuosa colonies inhabiting different depth habitats (D for deep and S for shallow). Multivariate comparison (fixed-effect MANOVA) among depths was significant (Wilks' λ = 0.2769; F = 30.7713 df = 14/167; P < 0.001). Misclassified colonies = 14 (7%). The canonical axis 1 mostly weighted by length and width of spindle and club, intercalice distance surface area and branch thickness, while canonical axis 2 was mostly weighted by width and length of clubs and calice density.

