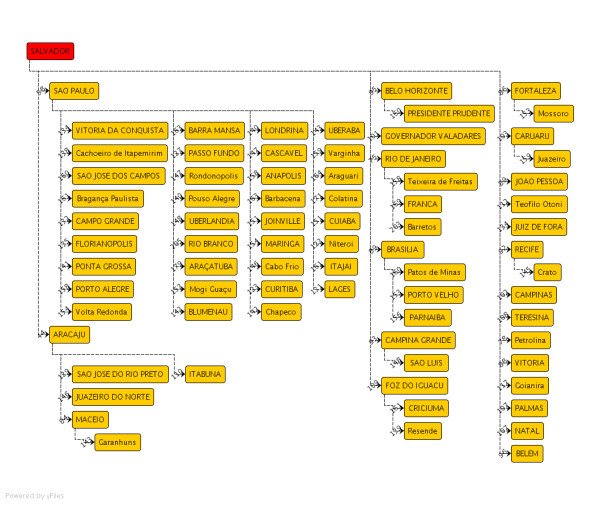
Figure 6.

Cost in vaccines applied vs. benefit in cases avoided, for a simulated epidemic starting at the highest degree city (São Paulo).

Cost in vaccines applied vs. benefit in cases avoided, for a simulated epidemic starting at the highest degree city (São Paulo).