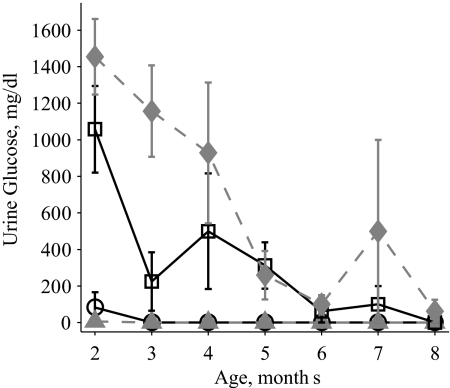
Figure 2.
Urine glucose in WT (circles, solid line), 2C (triangles, dashed line), OB (squares, solid line), and OB2C (diamonds, dashed line) mice. There was a significant effect of lep genotype and an interaction of lep and htr2c genotypes (htr2c, P = 0.051; lep, P < 0.0001; age, P < 0.0001; htr2c × lep, P = 0.04; htr2c × age, P = 0.99; lep × age, P < 0.0001; htr2c × lep × age, P = 0.99).

