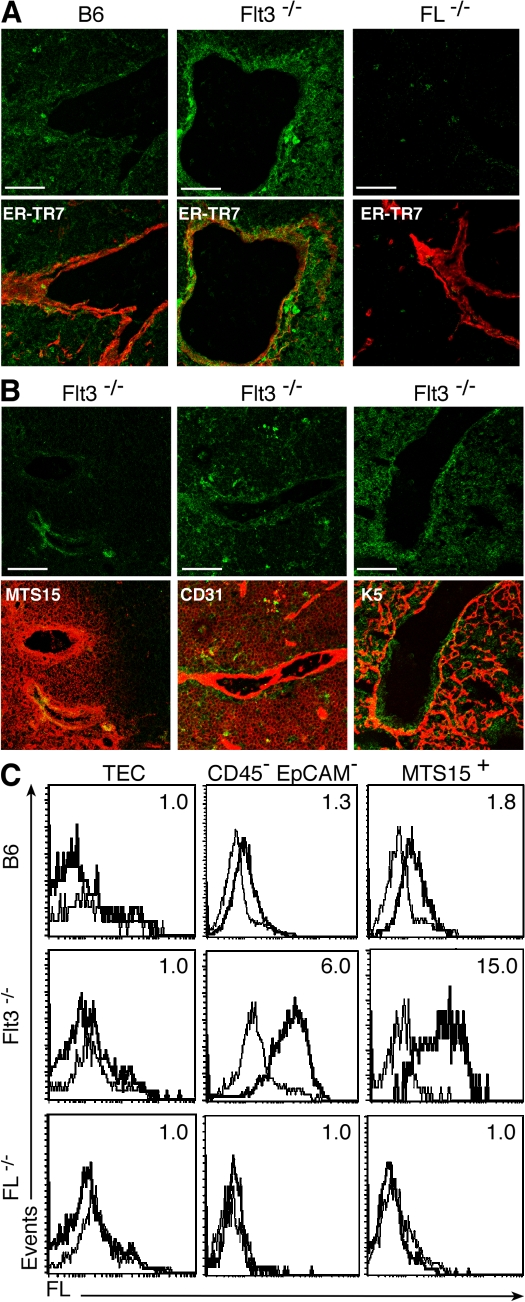
Figure 1.
FL is expressed at low levels by thymic perivascular fibroblasts in the B6 mouse and at high levels in the Flt3−/− mouse. (A) IHC of B6, FL−/−, and Flt3−/− mouse thymi. (top) FL only (green). (bottom) FL and ER-TR7 (red) to visualize blood vessels. Bars, 60 μM. (B) IHC of Flt3−/− mouse thymus. (top) FL alone (green). (bottom) FL and staining with a secondary antibody (red), as indicated. MTS15 recognizes perivascular fibroblasts, CD31 endothelial cells, and cytokeratin 5 (K5) medullary TECs. Similar results were obtained with at least five mice for each genotype. Bars, 60 μM. (C) FCM analysis of FL expression on thymic stromal cell subsets of B6, Flt3−/−, and FL−/− mice. TECs are defined as CD45−EpCAM+, nonepithelial stromal cells as CD45−EpCAM−, and thymic fibroblasts as MTS15+CD45−EpCAM− (MTS15+). FL expression (bolded line) and isotype (continuous line) are shown. Numbers in plots indicate the MFIR (MFI of FL/MFI of isotype control). All experiments were repeated at least three times with cells purified from different mice (all aged 8 wk).

