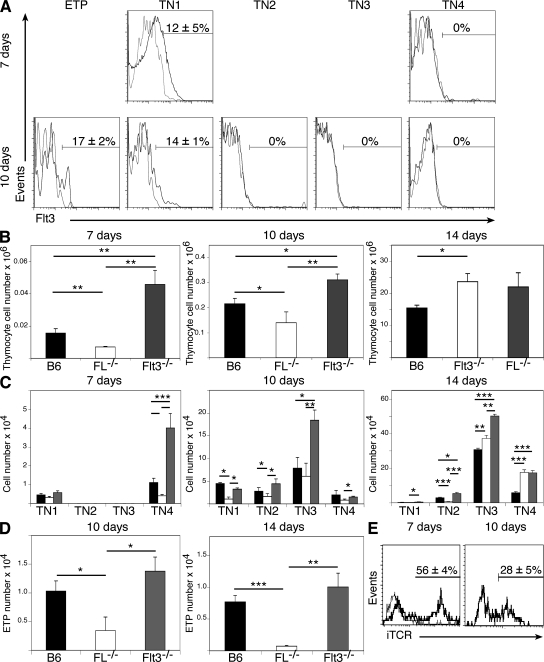
Figure 3.
Enhanced thymic reconstitution after lethal irradiation is dependent on thymic stromal FL expression. (A) Flt3 receptor expression on TN cell populations 7 and 10 d after lethal irradiation and BMT. Flt3 expression (black line) and isotype (gray line) are shown. Numbers in plots indicate the Flt3+ cell percentage ± SEM. (B–E) Reconstitution of thymus with donor-derived cells after irradiation and BMT at the time points indicated. (B) Total donor-derived cells. (C) Cell numbers of donor-derived TN subpopulation. (D) ETP cell numbers. (E) iTCR expression on TN4 cells at 7 and 10 d after BMT. iTCR expression (bolded line) and isotype (continuous line) are shown. Numbers in the plots indicate the iTCR-positive cell percentage ± SEM. n = 5 in all experiments. Error bars represent SEM. Statistics are based on an unpaired t test analysis. *, P < 0.05; **, P < 0.005; ***, P < 0.0005.

