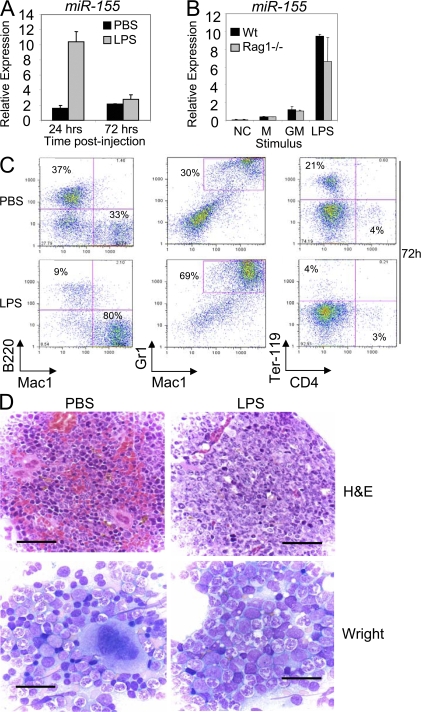
Figure 1.
LPS treatment induces bone marrow expression of miR-155 before GM expansion. (A) WT mice (n = 3 per group) were injected i.p. with 50 μg LPS dissolved in PBS or PBS alone. RNA was collected from total bone marrow cells, and miR-155 expression was assayed by quantitative PCR (mean ± SD). (B) Bone marrow was flushed out of the femurs and tibias of WT and Rag1−/− mice (n = 3 per group), stimulated with 100 ng/ml LPS, 100 ng/ml GM-CSF (GM), or medium (M) for 24 h, and RNA was then assayed for miR-155 expression levels (mean ± SD). NC, no template control. (C) BM cells collected from mice in A at the 72-h time point were stained with antibodies against Mac1, Gr1, B220, Ter-119, or CD4 and analyzed by FACS. (D) Wright-stained bone marrow smears (bottom; bar, 25 μM) or hematoxylin and eosin–stained bone marrow sections (top; bar, 60 μM) from WT mice injected with LPS or PBS for 72 h.

