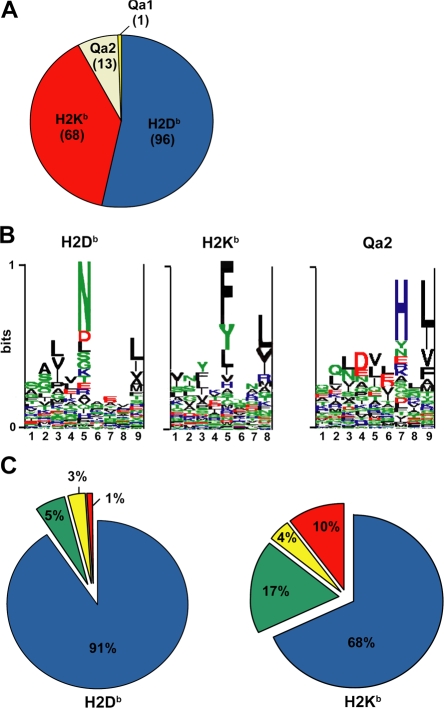
Figure 2.
Allelic distribution and binding scores of 178 MHC I–associated peptides eluted from EL4 cells. (A) Pie chart shows distribution of 178 MHC I–associated peptides eluted from EL4 cells. The smm, SYFPEITHI (H2Db and H2Kb), and Rankpep (Qa2) computational models were used to link individual peptides to MHC I allelic products. (B) Logo showing the profile motif for peptides presented by H2-Db, H2-Kb, and Qa2 molecules. Acidic (red), basic (blue), hydrophobic (black), and neutral (green) amino acids are illustrated. (C) Individual source proteins for peptides presented by H2Db and H2Kb (n = 164) were entered in the smm binding algorithm. We assessed the predicted MHC I binding affinity of all peptides contained in individual proteins. Pie charts show the proportion of peptides eluted from EL4 cells that ranked in the top 1% (blue), top 5% (green), top 10% (yellow), or below the 90th percentile of peptides (red).

