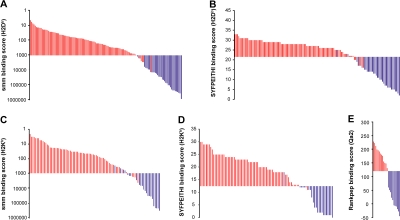
Figure 3.
Discrimination between MHC I–associated peptides and contaminant peptides using bioinformatic tools. (A–E) For peptides eluted from EL4 cells, the y axis shows computed MHC binding scores determined with the smm (A and C), SYFPEITHI (B and D), and Rankpep (E) computational methods. The x axis cut at the selected binding thresholds. Each bar represents a sequenced peptide. Individual H2Db-, H2Kb-, and Qa2-associated peptides (red) and contaminant peptides (blue) were scored as illustrated.

