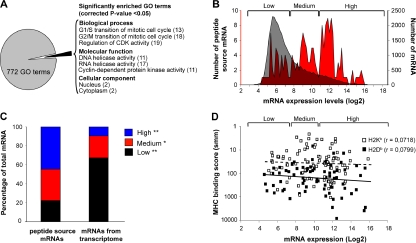
Figure 4.
Analyses of genes and transcripts coding MHC I–associated peptides eluted from primary thymocytes. (A) GO term enrichment analysis of 189 genes coding MHC I peptides eluted from thymocytes. Exact P values and global false-discovery rates were <0.05 for each listed GO term. Values in parentheses indicate the fold enrichment relative to the whole mouse genome. (B) We compared the relative abundance of two sets of thymic transcripts using previously reported microarray data (50): mRNAs coding MHC I peptides eluted from primary thymocytes (red), and 36,182 thymus-derived transcripts (gray). Original mRNA expression data on the x axis were plotted on a log2 scale. The y axes represent the number of transcripts for each sample set. (C) Frequency distributions for the two sets of thymic transcripts defined in B were plotted using a bin increment of 0.2. Three distinct mRNA expression groups are shown (low-, medium-, and high-abundance mRNA). Graph shows the proportion of mRNAs with low- (black), medium- (red), and high- (blue) abundance among the two sets of transcripts. *, P < 0.05; **, P < 0.0001. (D) Predicted MHC binding score (determined with smm) for peptides whose mRNA are expressed at low, medium, or high level. Spearman linear correlation coefficient (r) was calculated for H2Kb- (dashed line; white squares) and H2Db-associated (solid line; black squares) peptides.

