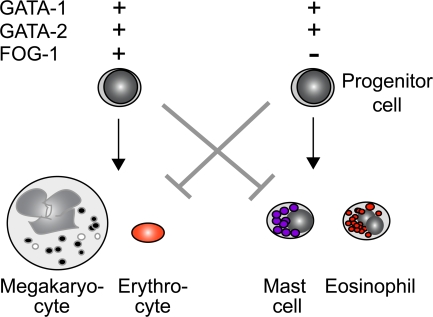
Figure 7.
Model of combinatorial control of erythrocyte/megakaryocyte versus mast cell/eosinophil lineage commitment by GATA-1 and GATA-2 depending on the presence of FOG-1. + and − refer to the presence or absence, respectively, of expression of each gene. The arrows represent the favored differentiation pathway, and the gray “T” bars represent the blocked differentiation pathway.

