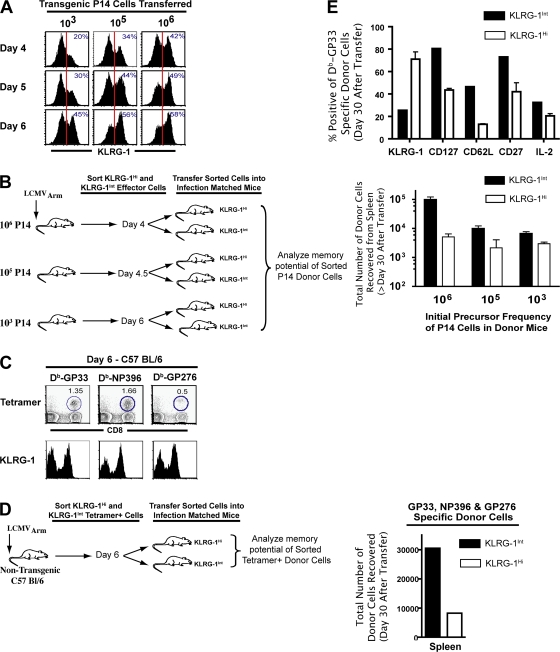
Figure 3.
Diverse cell fates associated with KLRG-1Int and KLRG-1Hi effector CD8 T cells are independent of initial precursor frequencies of antigen-specific cells and are seen with both Tg T cells and endogenous cells in normal B6 mice. (A) B6 mice adoptively transferred with low (103) or high (105 or 106) doses of naive P14 cells were infected with LCMV. CD8+ Thy1.1+ donor cells in the spleen were analyzed for cell-surface KLRG-1 expression at days 4, 5, and 6 p.i. Vertical red lines indicate the gate for intermediate KLRG-1 expression. (B) KLRG-1Int and KLRG-1Hi effector cells were sorted from B6 mice containing 106, 105, or 103 naive P14 cells at days 4, 4.5, and 6 p.i., respectively. KLRG-1Int and KLRG-1Hi donors from each group were transferred into infection-matched recipients, and total numbers of memory cells in the spleen were enumerated at days 40–60 after transfer. Mean data are plotted, and error bars represent SEM. (C) Non-Tg B6 mice were infected with LCMV, and 6-d p.i. cell-surface expression of KLRG-1 on DbGP33-, DbNP396-, and DbGP276-specific CD8 T cells was assessed using anti-CD8α, anti–KLRG-1, and the respective MHC class I tetramers. Numbers show the frequency of tetramer-positive cells. (D) Tetramer-specific cells were sorted into KLRG-1Int and KLRG-1Hi populations from Thy1.2+ B6 mice infected with LCMV 6 d earlier. A total of 1.5 × 10⁶ KLRG-1Hi– and KLRG-1Int–sorted DbGP33+ DbNP396+ DbGP276+ cells were transferred into infection-matched Thy1.1 recipients. Total numbers of DbGP33+ DbNP396+ DbGP276+ donor cells in the spleen are shown at 20 d after transfer. (E) Surface markers were analyzed on DbGP33-specific CD8 T cells by direct ex vivo staining of splenocytes, and production of IL-2 by memory cells was determined by ex vivo stimulation with GP33 peptide for 5 h. Bar graphs represent the fraction of donor cells expressing the indicated markers. Mean data are plotted, and error bars represent SEM.

