Figure 3.
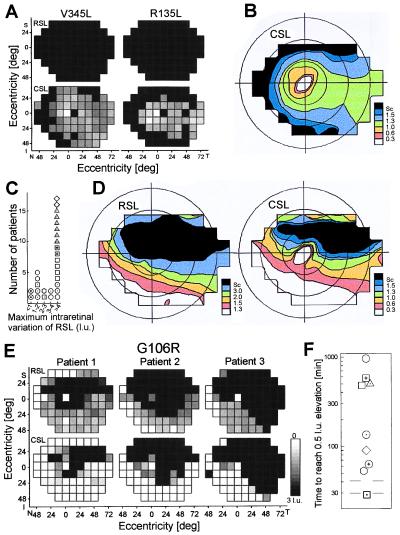
Topographical variation of rod and cone dysfunction. (A) Maps of RSL and CSL in two class A patients, V345L and R135L, displayed in Fig. 2A. (B) Summary contour map of CSL in eight class A patients displaying 50th percentile contours of selected sensitivity losses; the loss in l.u. for each contour shown on the color scale (Sc, scotoma); isoeccentricity lines are 20, 40, and 60°. Maps are shown as a visual field of the right eye. (C) Histogram of the maximum intraretinal variation of RSL in 28 class B patients with relatively mild dysfunction (<1.5 l.u. of RSL in some retinal regions). (D) Summary contour maps of RSL and CSL for 16 class B patients showing >3 l.u. of intraretinal RSL variation. (E) Maps of RSL and CSL in three family members with the G106R mutation having increasing (left to right) degrees of disease severity (displayed as in Fig. 2A). (F) Dark adaptation kinetics of class B disease, representing nine mutations. Each symbol is the time to recover to within 0.5 l.u. of prebleach sensitivity after a 99% bleach; results of two to three least affected patients of each mutation are averaged. Gray lines show the normal limits.

