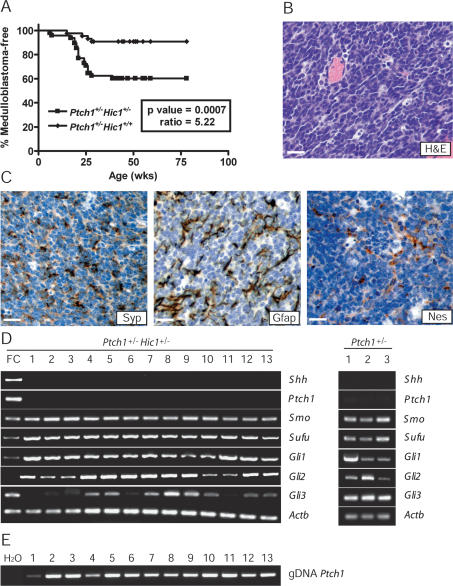
Figure 1.
Hic1 interacts with Ptch1 in the pathogenesis of medulloblastoma. (A) Log-rank Kaplan Meier analysis of tumor incidence in Ptch1+/− Hic1+/− mice versus Ptch1+/− mice. (B) Hematoxylin/eosin staining of representative tumor from Ptch1+/− Hic1+/− animal. Bar, 20 μm. (C) Immunohistochemical stains for Synaptophysin (Syp), Glial fibrillary acid protein (Gfap), and Nestin (Nes) in a representative tumor, shown as DAB staining (brown), counterstained with hematoxylin (blue). Bars, 20 μm. (D) Semiquantitative Hh pathway expression profiling of 13 Ptch1+/− Hic1+/− and three Ptch1+/− tumors. Mouse fetal cerebellum (FC) (Clontech) used as positive control. (Shh) Sonic hedgehog; (Ptch1) Patched1; (Smo) Smoothened; (Actb) β-Actin. (E) Nonquantitative Ptch1 PCR on genomic DNA from 13 Ptch1+/− Hic1+/− tumors.

