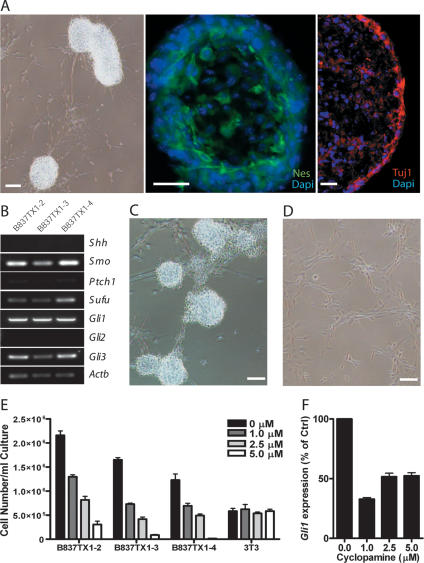
Figure 2.
Medulloblastomas from Ptch1+/− Hic1+/− mice are Hh pathway-dependent. (A) A tumor-sphere cell line derived from a Ptch1+/− Hic1+/− tumor: phase contrast image (bar, 50 μm), immunofluorescent staining for Neuronal class III β-Tubulin (Tuj1) and Nestin (Nes) expression (bars, 25 μm). Nuclei counterstained with DAPI (blue). (B) Hh pathway expression profiling in three cell lines derived from a Ptch1+/− Hic1+/− tumor. (C) Representative phase contrast image of Ptch1+/− Hic1+/− tumor-sphere cell line treated with vehicle control (4×). (D) Representative phase contrast image of Ptch1+/− Hic1+/− cell line treated with 5 μM cyclopamine (4×) (bars, 50 μm). (E) Cell concentrations of Ptch1+/− Hic1+/− medulloblastoma cell lines B837TX1-2–B837TX1-4, and mouse fibroblast cell line NIH-3T3 (3T3) after 7 d of culture with 0 μM, 1 μM, 2.5 μM, or 5 μM cyclopamine. (0 μM) Vehicle control. Error bars reflect SEM of five biological replicates. (F) Gli1 quantitative PCR performed on RNA isolated from B837TX1-3 following 7 d of culture in 0 μM, 1 μM, 2.5 μM, or 5 μM cyclopamine. Data are graphed in relation to untreated B837TX1-3. Error bars reflect SEM of five biological replicates.

