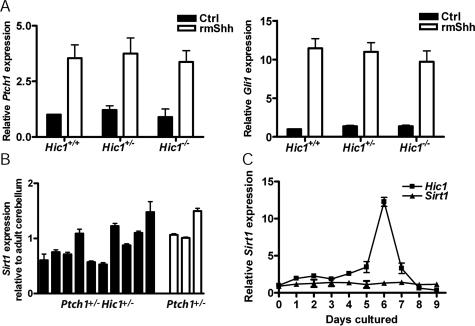
Figure 5.
Hh signaling and Sirt1 expression in medulloblastoma. (A) Ptch1 and Gli1 quantitative PCR in MEFs derived from Hic1+/+, Hic1+/−, and Hic1−/− E17.5 embryos. MEFs were either treated with recombinant mouse Shh or a PBS control. Ptch1 and Gli1 transcript levels are graphed relative to untreated Hic1+/+ MEFs. Error bars reflect SEM of three biological replicates. (B) Sirt1 quantitative PCR in 12 Ptch1+/− Hic1+/− and three Ptch1+/− tumors. Sirt1 RNA expression is graphed relative to Sirt1 expression in C57Bl/6 adult cerebellum. Error bars reflect SEM of three technical replicates. (C) Sirt1 quantitative PCR in GCPs cultured for 7 d. Error bars reflect SEM of biological replicates.

