Figure 6.
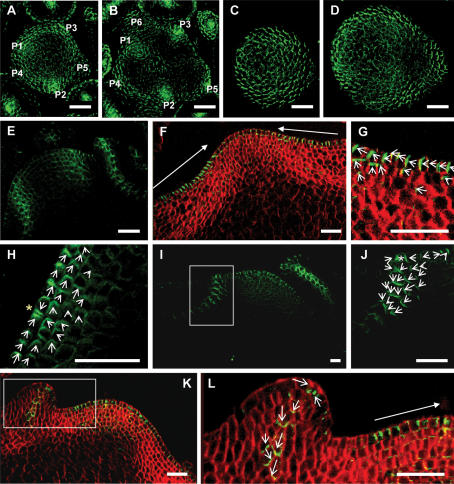
PIN1 polarization in the quadruple aux1 lax mutant. Green signal is PIN1 protein. Red signal is calcafluor staining of the cell walls. PIN1 localization visualized in maximal projections of serial optical sections, made by confocal imaging. (A–D) Transversal sections. (A,B) Wild-type meristem. Primordia labeled in order of initiation, with P1 the most recently initiated. (A) Ten to twenty microns below the meristem summit, showing convergent PIN1 polarization in incipient and outgrowing primordia in the L1 of the peripheral zone. (B) Twenty to thirty microns below the summit with PIN1 polarization toward developing vasculature of incipient and outgrowing primordia. (C,D) quad meristem. (C) Ten to twenty microns below the quad meristem summit, showing diffuse PIN1 polarization. (D) Twenty to thirty microns below the summit, showing diffuse PIN1 polarization. (E–L) Longitudinal sections. (E) Central section through a wild-type meristem, showing convergent PIN1 localization in incipient and outgrowing primordia and basipetal PIN1 polarization along the sites of developing vasculature. (F) Central section through a quad meristem with no recently initiated primordia, showing polarization of PIN1 toward the meristem summit in the L1 layer stretching to the periphery of the ZND. (G) Enlargement of the right-hand ZND of the meristem shown in F, showing polarization of PIN1 toward the meristem summit in the L1 and apical polarization in the L2. (H) Peripheral zone of a quad meristem with no newly initiated primordia showing convergent polarization in two cells of the PZ (yellow star). (I) A quad meristem with an incipient primordium in the PZ on the left and a recently initiated primordium to the right. (J) Enlargement of the incipient primordium indicated by the rectangle in I, showing an L1 convergence point (white star) and basal polarization of PIN1 in underlying cell layers. (K) A quad meristem with a newly initiated primordium in the PZ on the left. (L) Enlargement of the newly initiated primordium indicated by the rectangle in K, showing basal polarization of PIN1. Closed-headed arrows show the general direction of polarization in a group of cells. Open-headed arrows show the direction of PIN1 polarization in each cell. White rectangles indicate areas enlarged in the next panel. Bars, 25 μm.

