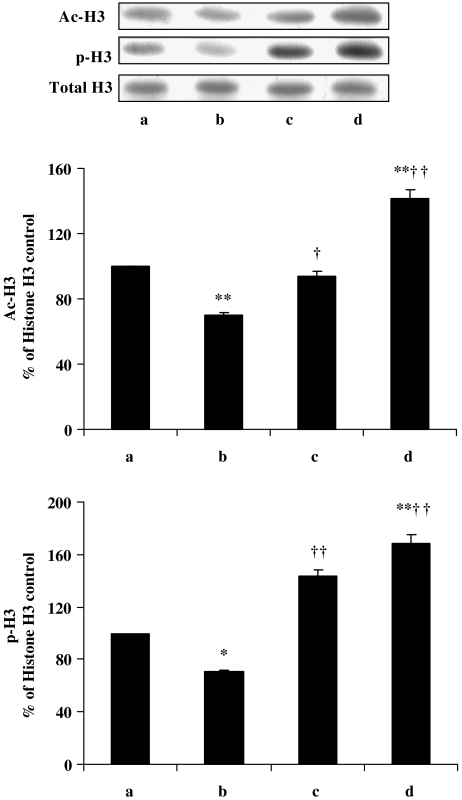
Figure 3.
Western blot of acetylation and phosphorylation of histone H3 in kidney after treatment with curcumin in diabetic rats. Lane a, normal/control; lane b, diabetic/control; lane c, diabetic/curcumin treated and lane d, control/curcumin treated. Results were normalized with respect to total histone H3. Similar results were obtained in three independent set of experiments. All the values represent mean±s.e.mean (n=3). **P<0.01; *P<0.05, significantly different from normal/control; ††P<0.01; †P<0.05, significantly different from diabetic/control. Ac-H3, acetylated histone-H3; p-H3, phosphorylated histone-H3.

