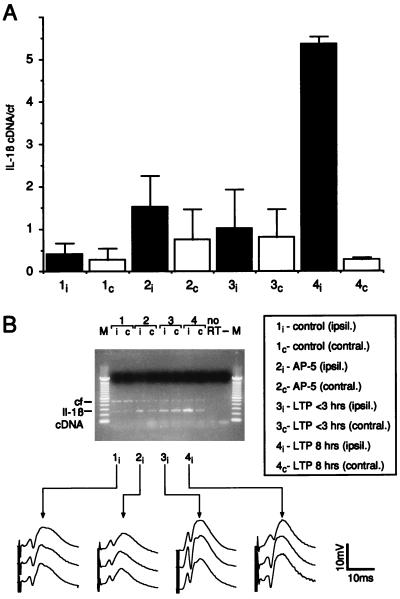
Figure 2.
IL-1β gene expression during LTP in vivo. (A) IL-1β mRNA expression 8 hr after tetanization. Thirty minutes before tetanization, animals received either physiological saline (groups 1, 3, and 4) or AP-5 (group 2) administered i.c.v. Black bars indicate measurements performed in ipsilateral (i) and white bars in contralateral (c) hippocampi. Group 1: hippocampi of animals recorded under baseline conditions without tetanic stimulation. Group 2: hippocampi of animals in which the expression of LTP after tetanization was blocked by AP-5. Group 3: hippocampi of animals showing a potentiation that returned to baseline within 3 hr. Group 4: hippocampi of animals with a robust LTP lasting for 8 hr. Results of RT-PCR are expressed as mean ± SEM of the ratio IL-1β cDNA and the competitive fragment (cf). n = 4 per group. Group 4i differs significantly from all other groups (P < 0.05; ANOVA followed by Fisher test for multiple comparisons). (B) Representative ethidium bromide-stained agarose gel showing the amplified transcripts of a RT-PCR obtained from ipsi- and contralateral hippocampi that were subjected to different experimental conditions (lane numbers correspond to the groups shown in A). The line graphs display representative analog traces recorded during baseline (Top), immediately after tetanization (Middle) and 8 hr after tetanus (Bottom). M, 100-bp ladder molecular weight marker; no RT, RT-PCR without addition of reverse transcriptase; −, RT-PCR without addition of cDNA.

