Fig. 2.

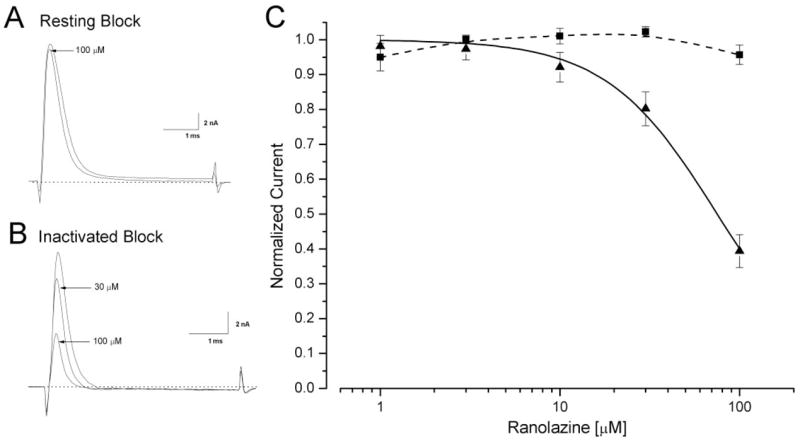
Block of resting and inactivated rNav1.4 Na+ channels at various ranolazine concentrations. A, representative current traces are superimposed before and after application of 100 μM ranolazine. Cells were held at −140 mV and received 5-ms test pulses of +30 mV at 30-s intervals. B, representative current traces are superimposed for ranolazine concentrations of 0, 30, and 100 μM. After a −70-mV conditioning pulse for 10 s, Na+ currents were evoked by the 5-ms test pulse at 30 mV, administered every 30 s. An interpulse of 95 ms at the holding potential was inserted to allow the recovery of the drug-free inactivated Na+ channels. C, a dose-response curve was constructed using data described in Fig. 2A (resting block: ■, n = 5) and 2B (inactivated block: ▲, n = 6). The peak current was measured, normalized to the control (0 μM), and plotted against the ranolazine concentration. The curve was fitted with the Hill equation (solid line). The IC50 value for resting block was >300 μM and could not be experimentally attained. The IC50 value for inactivated block was estimated at 75.0 ± 3.5 μM (Hill coefficient, 1.41 ± 0.10, n = 6).
