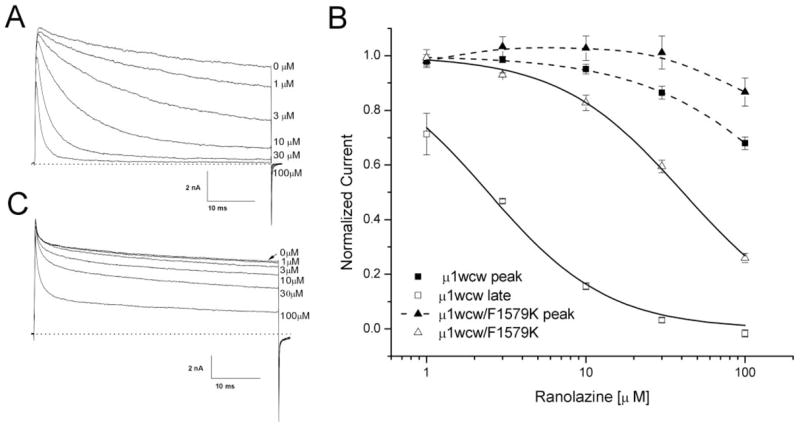
Fig. 6.

Block of inactivation-deficient rNav1.4-WCW and rNav1.4-WCW/F1579K Na+ channels. A, representative current traces of inactivation-deficient rNav1.4-WCW Na+ channel block were superimposed at various ranolazine concentrations. Cells were held at −140 mV and received 50-ms test pulses of +30 mV at 30-s intervals. B, a dose-response curve was constructed from the data presented in Fig. 6A. Both peak (■) and late (□) currents were measured, normalized to the control (0 μM), and plotted against ranolazine concentration. The curve was fitted with the Hill equation (solid lines). The IC50 value for the peak current block was estimated 225.4 ± 16.3 μM (Hill coefficient, 0.92 ± 0.05) (n = 5) and the IC50 value for rNav1.4-WCW of the late current was 2.4 ± 0.2 μM (1.15 ± 0.09) (n = 5). C, representative current traces of rNav1.4-F1579K inactivation-deficient Na+ channel block were superimposed at various ranolazine concentrations. Currents were evoked using the pulse-protocol represented in A. Peak and late Na+ currents were measured, normalized, and plotted against concentration as shown in B (triangles). The estimated IC50 value for rNav1.4-F1579K inactivation-deficient channel block of the late current was 40.8 ± 1.3 μM (Hill coefficient, 1.12 ± 0.04) (n = 5).
