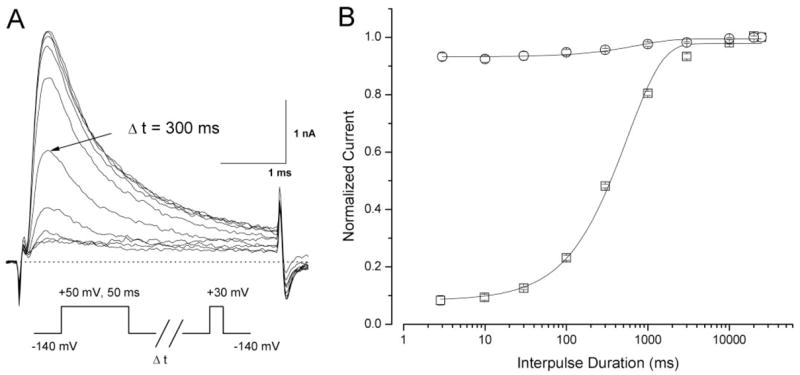
Fig. 8.

Recovery time course from ranolazine open-channel block at 100 μM. A, a conditioning pulse of +50 mV for 50 ms was applied to induce the time-dependent block of rNav1.4-WCW Na+ currents at 100 μM ranolazine. Representative traces of rNav1.4-WCW Na+ currents were evoked by a +30-mV test pulse after an interpulse at −140 mV with an increasing duration and superimposed. The pulse protocol is shown in the inset. B, normalized peak current after drug treatment (100 μM ranolazine; squares) was plotted against the interpulse duration and fitted by an exponential function with a τ value of 558.2 ± 40.7 ms (n = 5). The control data before drug treatment (circles; n = 5) was shown for comparison; most currents (>90%) reappeared within 3 ms.
