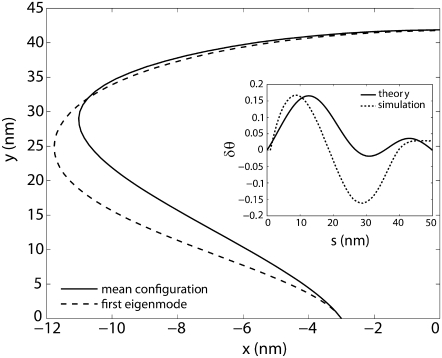
FIGURE 5.
The first eigenmode of the fluctuating loop obtained from MC simulations. The solid line represents the mean configuration and the dashed line represents the deformation due to the fluctuations along the first eigenmode. The end-to-end distance of the loop is fixed and so are the angles made by the tangents (to the x axis) at the ends. The inset shows the corresponding change in the tangent angle δθ as a function of the arc-length s calculated using theory (solid line plotted using Eq. 23) and using MC simulations (dotted line) calculated as described in Eigenmode Calculation.

