Abstract
The putative functions and functional efficiencies of periodic nanostructures on the surface of cicada wings have been investigated by atomic force microscopy (AFM) used as a tool for imaging, manipulation, and probing of adhesion. The structures consist of hexagonal close-packed protrusions with a lateral spacing of ∼200 nm and may have multiple functionalities. Not only do the structures confer survival value by virtue of camouflage, but they may also serve as antiwetting and self-cleaning surfaces and thus be resistant to contamination. These effects have been demonstrated by exposure to white light, liquid droplets, and AFM adhesion measurements. The dependence of optical reflectivity and surface adhesion on surface topography has been demonstrated using AFM as a nanomachining tool as well as an imaging and force-sensing probe. The intact arrays display exceptionally low adhesion for particles in the size range 20 nm–40 μm. The particles can be removed from the array by forces in the range 2–20 nN; conversely, forces in the range 25–230 nN are required to remove identical particles from a flat hydrophilic surface (i.e., polished Si). Measurements of contact angles for several liquids and particle adhesion studies show that the wing represents a low-surface-energy membrane with antiwetting properties. The inference is that a combination of chemistry and structure constitutes a natural technology for conferring resistance to contamination.
INTRODUCTION
In arthropods, a layer of cells that make up the epidermis secrete what is referred to as a cuticle over large areas including the external surface, the tubular tracheal system in insects, and regions of the gut and reproductive system. Recent reviews of cuticle composition and investigation of its material properties include those by Gorb (1), Vincent (2), and Vincent and Wegst (3), although much insight can be gained from the comprehensive earlier studies of Neville (4) and Chapman (5).
In some examples, the surface of the cuticle is endowed with a nanometer-scale architecture that has specific and biologically advantageous properties. One of the early studies was carried out by Bernhard and Miller (6), who described a nanostructured array on compound insect eyes. The structures were found on the cuticular lens (ommatidial surface) and were shown to have an antireflection function. Previous studies using atomic force microscopy (AFM) have measured mechanical stiffness of ommatidial nanoarrays of moths (7). The tapered protrusions constitute a gradient optical impedance matching at the air-to-cuticle interface, enhancing photon collection, and reducing reflectance (6,8). The effect occurs over a wide range of frequencies and a broad range of angles of incidence and can be described by the effective medium theory (9). Such ommatidial arrays arose early in evolutionary terms, having been found on the surface of eyes of Diptera (true flies) in amber from the Eocene period (10) and in Trichoptera (caddisflies), also from amber, and dated to an age of 40–50 million years (11). More recently, nanoarrays have been identified on the wings of insects (12,13). These arrays have also been implicated in antireflectance and an enhancement of transparency, thus producing a near-invisible wing. Indeed there is evidence that transparent wings have an impact in terms of visibility both to predators and other competing insects and to prey (14), which suggests that natural antireflection technologies should be beneficial for some species. Arrays may also have a color function. The black wing scales of certain Lepidoptera (e.g., butterflies and moths) may derive opacity from absorption of light because of the presence of melanin-based pigment (8).
Other materials' properties have been related to these nanoarrays, such as antiwetting and self-cleaning, e.g., superhydrophobicity (15). Superhydrophobicity is best known in the case of the lotus leaf (the lotus effect) but is also present in rice and numerous other plant species (16). Antiwetting arrays have now also been observed on various insect species (17–19), although the current database is limited. Many of the insect species demonstrating this interaction with water are relatively long or large-winged (e.g., butterflies) (20). Distal contamination and wetting of the wings may lead to an increase of the moment of inertia and reduce aerodynamic efficiency (21). Thus, it may be beneficial for long-winged insects that are unable to clean their wings with their extremities to have microstructures that reduce wettability and/or have self-cleaning properties (21). Also, some insects closely connected with water bodies in their life cycle possess microsculptures that decrease the wettability of wings (e.g., Odonata) (22).
AFM is now a widely deployed tool for investigation of wetting properties and surface energies of a range of surfaces based on adhesion measurements (e.g., 23–25). As yet, there have been few AFM-based studies of adhesion in the case of insect nanostructures. In particular, we are not aware of AFM being used to measure adhesion on nanostructured insect wings. The particular merit of AFM in the current context is that the technique can be used to carry out controlled manipulation of the array structure and can thus help to confirm and quantify the role of surface geometry for properties such as wetting, adhesion, and reflectance. In this article we investigate measurable changes in characteristics associated with ordered structure arrays and suggest how these may play a biological role.
EXPERIMENTAL
Electron microscopy
In the case of scanning electron microscope (SEM) imaging, a square of dried wing tissue (∼3 × 5 mm2) was excised and mounted on an aluminum pin-type stub with double-sided adhesive, then sputter coated with 7–10 nm of platinum, before being imaged using a JEOL (Peabody, MA) 6300 field emission SEM at 8 kV.
Reflectance measurements
Reflectance data were acquired with a THALES OPTEM 100C Series 10:1 Zoom Optical System (Qioptiq Imaging, Rochester, NY) fitted with a Carl Zeiss (Jena, Germany) 40×/0.60 objective and 10 mm fiber optic adaptor, all assembled on a framework that was purpose-built for simultaneous AFM imaging and optical measurements. The source of incident light was an EKE 150-W lamp (ellipsoidal dichroic reflector) with transmission from 400 to 700 nm. Reflectance data were collected using EPIX XCAP V2.1 software (EPIX, Buffalo Grove, IL) (the spectral response was flat across the 400–700 nm range).
Contact angle measurements
To eliminate effects of the vein structure on the wing membrane, the water droplets were placed on regions sufficiently large to accommodate the droplet footprint. Droplets of 10 μl Milli-Q water were applied to the wing membrane (dorsal cell region between veins CuA and M), which was attached to a glass substrate with double-sided adhesive tape. Smaller droplets were difficult to place on the membrane surfaces because the adhesion between the water droplet and the syringe needle was stronger than the force of gravity and adhesion of the cuticle surface. Two other liquids (formamide and diiodomethane) were also utilized for contact angle measurements (method as per water). The static contact angles were measured with a horizontal microscope with digital capturing of the images for precise measurements utilizing 10 droplets per liquid (with 10 measurements per droplet). The measurements were taken at ambient conditions of 21°C and relative humidityof 60–70%.
AFM instrumentation and probes
Cicada wings (dried samples) were surgically separated by scalpel. The forewings were cut into smaller sections (3 × 5 mm2) and attached by adhesive tape or by an epoxy resin to AFM-mounted stubs.
The investigations were carried out on two multitechnique/multimode instruments: a ThermoMicroscope (Sunnyvale, CA) TMX-2000 Explorer/Discoverer and a JEOL JSPM-4200. The two instruments have broadly comparable capabilities and are both based on detection of tip-to-surface forces through the monitoring of the optical deflection of a laser beam incident on a force-sensing/imposing lever. Several scanners were used to attain appropriate image sizes; the fields of view ranged from 100 × 100 down to 1 × 1 μm2. The analyses were carried out under air-ambient conditions (temperature of 20–25°C and 40–65% relative humidity). The probe consists of a lever and an integral tip. “Beam-shaped” probes (NT-MDT Ultrasharp, MikroMasch, Estonia) were used throughout the work. Typical parameters, as reported by the manufacturer, were: normal force constant, kN, of 0.03–4.5 N/m; conical tip shape with cone angle <20°, radius of curvature of the tip <10 nm, and tip height 10–15 μm. The actual normal force constant was determined from the resonance method (26), and the torsional force constant was calculated from the expression for a long and thin lever (27,28).
Topographical imaging was carried out at constant force in contact mode, with a lever-imposed normal force in the range 5–15 nN. The scanning rate in the fast-scan direction was ∼3 Hz, and a typical image was composed of 500 × 500 pixels.
Force versus distance (F-d) analysis was used to obtain adhesion data. The tip is held stationary at an x-y (sample plane) location and is ramped along the z axis, first in the direction of approach and contact with the surface and then in the reverse direction. F-d curves were acquired at rates of translation in the z direction in the range 2–10 μm s−1. Each F-d curve consisted of 300–600 data points. The attachment procedure of SiO2 spheres to AFM probes has been described in the literature (29,30). Fifty measurements per particle-substrate size combination were acquired.
Lithographic patterning of the cicada membrane was carried out by translating the tip in the contact mode at a chosen angle with respect to the fixed geometry of the lever. The loading force was typically in the range of 450–1200 nN. The manipulation mode whereby surface material was removed from the membrane, thus producing square-well features, was implemented by scanning the lever in a raster pattern at a frequency of 15–25 Hz in the fast scan direction. The raster consisted of 512 scan lines. The depth of the excavated regions was controlled by force loading and number of raster cycles. Subsequent to the surface being altered, one raster cycle at lower force loadings (50–100 nN) was carried out over a larger field of view to remove excavation debris. In the case of grid patterning, the AFM was operated in the scan-line lithographic mode with scan speeds and loading forces in the same range as those used for creating excavated wells.
RESULTS AND DISCUSSION
Manipulation by AFM and reflectance measurements
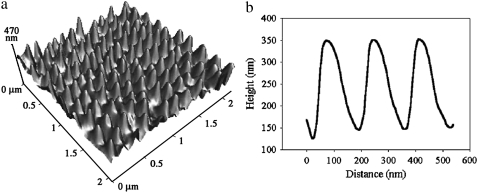
Fig. 1 shows topographical AFM images of the surface of a cicada wing (Psaltoda claripennis). Similar features have been observed on the wings of a number of cicada species (Tamasa tristigma, and Cicadetta oldfieldi) (19) and more recently on Macrotristria angularis, Thopha saccata, and Aleeta curvicosta (31), where the chemistry of the cicada cuticle was investigated. The features are present on all areas of the dorsal and ventral wing membrane sections. The structures are remarkably similar to those of the moth eye, having a near-identical spacing in the x-y plane, extension along the z axis, and comparable shapes. An earlier study examined related properties, such as wing stiffness, by AFM on cicada specimens; it found that array structures were also present on the nontransparent vein elements of the wing (19).
FIGURE 1.
High-resolution AFM three-dimensional image of the dorsal region of a cicada wing membrane (Pflatoda claripennis) (a) and corresponding height profile along a close-packed direction (b). The apparent asymmetry is an artifact of the 10° tilt angle of the lever.
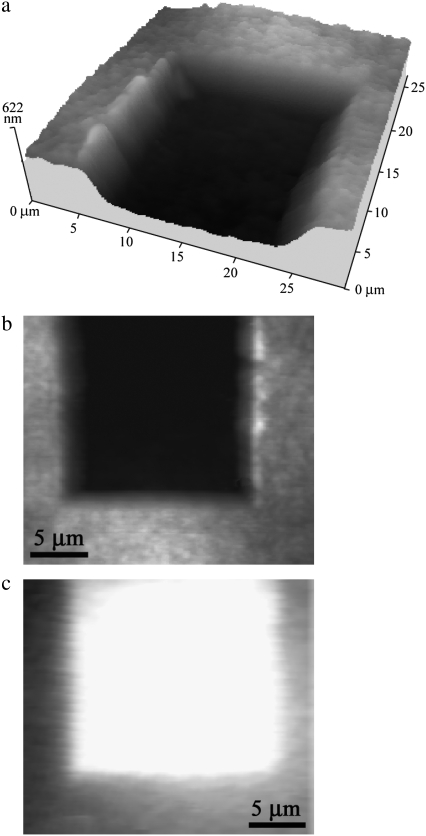
To investigate the possible function of the nanoarray structures as an antireflective coating, manipulation by AFM was carried out to remove a section of the wing membrane. Fig. 2, a and b, shows an AFM image of the outcome resulting from removal of a volume of ∼20 × 20 μm2 in the lateral dimensions and to a depth of 300 nm. The optical image in Fig. 2 c shows clearly that the removal of the nanostructures produced a region on the membrane exhibiting higher reflectivity than the “virgin” intact surrounding regions.
FIGURE 2.
(a) Three-dimensional AFM image of a region on a cicada membrane after AFM-based nanomachining. (b) AFM gray-scale image of the same region as in a. (c) Reflectance image of the manipulated section and surrounding intact region.
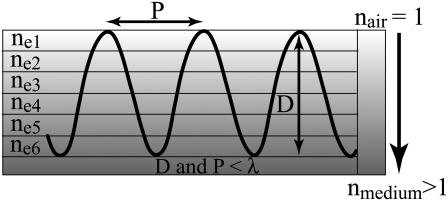
The optical properties of subwavelength antireflective structures can be explained by considering a profile, essentially a grating, that is periodic in one dimension (see Fig. 3). If the period is larger than the wavelength of incident radiation, then the light is scattered into a number of wavelets. When the grating constant is small in comparison with the wavelength of incident light, only the zero-order diffracted wave will propagate. Whether a diffraction order propagates or not is determined by the grating equation
 |
(1) |
where ni and n are the indices of refraction seen by incident rays and for rays propagating through a medium, respectively. Thus n = ni for reflected rays, whereas n = ns for transmitted rays. θi and θm are the angle of incidence and the angle of the mth order diffracted ray measured from the normal to the grating, respectively. λ is the incident wavelength in free space, and P denotes the period of the grating.
FIGURE 3.
Diagrammatic representation of a multilayered stack coating (gradient index coating) with each coating ne1–ne6 having a successively greater index of refraction. The periodic features represent a pseudogradient index coating consisting of structures with a periodicity and height in the nanometer range where P is the repeat distance of the structures, D is the height of structures, and λ is the wavelength of incident light.
If the m = 0 order propagates in the substrate or incident medium at a given value of λ, and at incident angles θi up to θmax, the maximum angle of incidence, Eq. 1 yields the following expression, which will give an upper bound for the ratio
 |
(2) |
where max[x, y] refers to the greater of the arguments within the bracket. The incident wavelength must always be greater than the spacing of the surface structures to avoid energy loss to diffracted orders, as stated by the inequality in Eq. 2. When light is incident on a medium with n = 1.5 (31), surrounded by air, the largest spacing satisfying Eq. 2 would be ∼200 nm for radiation in the visible part of the spectrum, in agreement with that observed for the nanostructures on the cicada wings.
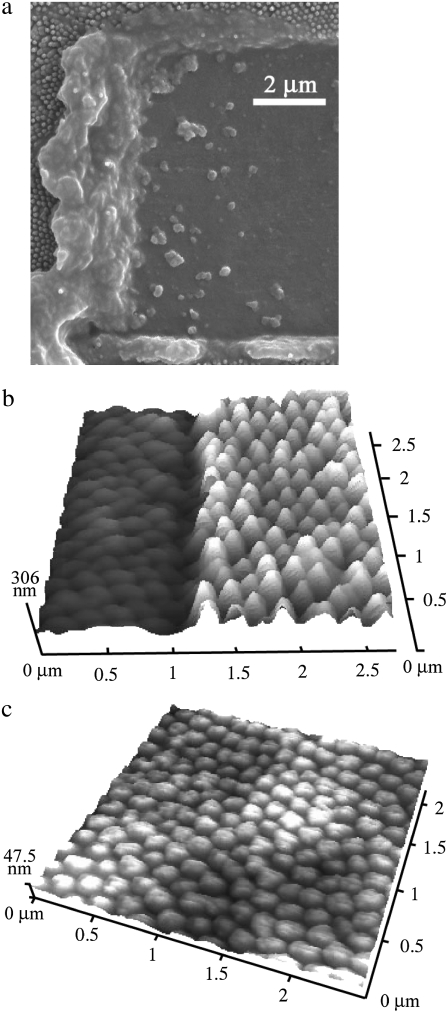
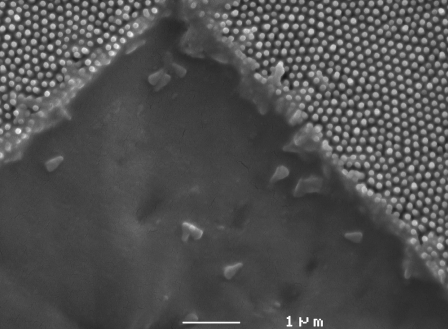
The removal of membrane material as seen in Fig. 2 is a result of in-plane as well as out-of-plane forces being applied by the AFM tip. Although it is possible that the alteration of the array structures results in part from irreversible deformation, material is principally being removed by shear. Fig. 4 shows an SEM image obtained after manipulation of the surface with a sharp AFM probe. The buildup of material at the scan edges confirms that removal was the dominant process as opposed to a deformation mechanism. AFM images of such manipulated regions showed a correlation between the volume of deposited material and debris at the image boundaries. The high-resolution images in Fig. 4, b and c, show that the array structures are indeed reduced in height by manipulation while still retaining the hexagonal close-packed arrangement. The removal process is dependent on the condition of the tip; those with larger curvature (blunt tips) tend to crush the nanostructures, as opposed to sharper tips, for which shearing is the dominant mechanism. Tips with a greater radius of curvature are likely to distribute the applied force over a larger area. SEM images of regions where alteration was carried out provide evidence of both processes and also show that complete removal of the nanostructures is possible (see Fig. 5).
FIGURE 4.
(a) SEM image of a region on a cicada membrane subjected to alteration. (b and c) The removal of material was carried out at an applied force loading of 500 nN and repetitive raster cycles consisting of 500 lines. The images were obtained at low-force loading (7 nN) in the contact mode. The high-resolution images show altered regions resulting from removal of material to a depth of 120 nm (region showing excavated and intact sections) and 180 nm, respectively.
FIGURE 5.
SEM image of an excavated region showing complete removal of the cuticular nanostructures.
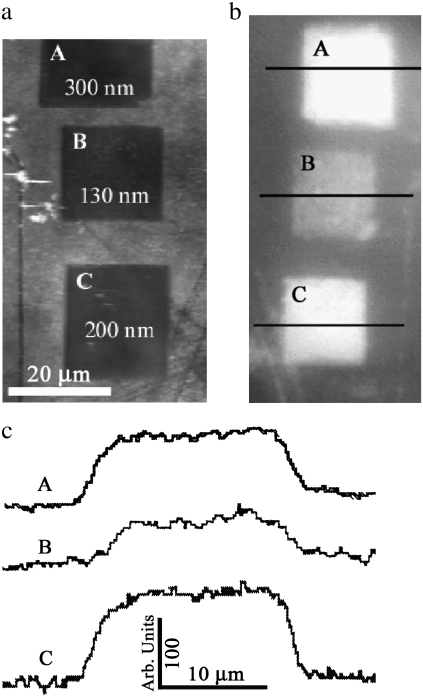
To investigate the function(s) and effectiveness of the array structures, several regions of the membrane were nanomachined to produce a range of depth profiles of the nanostructures. Fig. 6 a shows a topographical image of the removal of material from the wing corresponding to depths of 130, 200, and 300 nm (squares B, C, and A, respectively). Fig. 6 b shows corresponding optical images of the manipulated regions in Fig. 6 a, with the respective intensity profiles in Fig. 6 c. The excavated regions corresponding to 200 and 300 nm (squares C and A, respectively) produced similar reflectivity outcomes in the visible spectra.
FIGURE 6.
(a) AFM gray-scale image of regions after alteration: squares A, B, and C correspond to depths of removal of 300, 130, and 200 nm, respectively. (b) Optical images in reflectance mode of the manipulated section and surrounding intact region. (c) Reflectance intensity profiles of the manipulated regions.
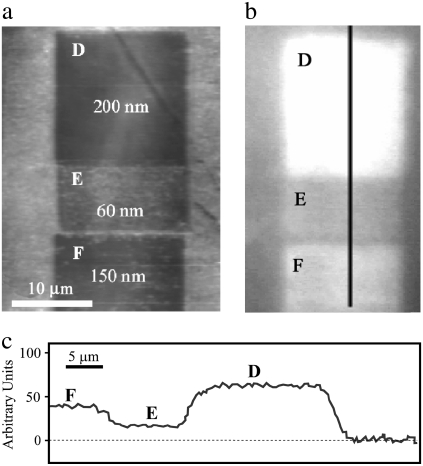
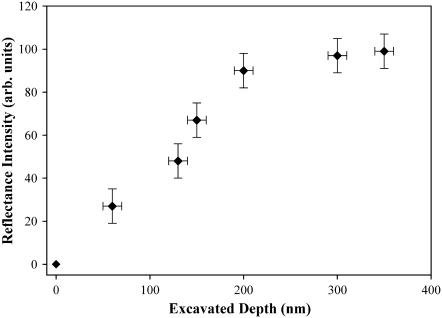
Removal of material to a depth of 200 nm will result in the height of the structure being reduced from ∼225 to ∼25 nm. At this height, the structures offer very little reduction in reflectance. At a depth of 130 nm (structure height 100 nm), reflectance is significantly reduced. Fig. 7 a shows additional topographical images together with data in Fig. 7 b demonstrating reflectance of the membrane after removal to depths of 60, 150, and 200 nm (squares E, F, and D, respectively) resulting in structure heights of 165, 75, and 25 nm shown in Fig. 7 c. The greater heights of the structure show greater effectiveness in reducing reflections. The intensities plotted in Fig. 8 exhibit a near-linear dependence on structure height and demonstrate that removal of material to depths greater than the dimensions of the nanostructures results in no further change in reflectivity. As the structures become smaller in height, the gradient in refractive index becomes compressed and nonlinear and thus less effective. Taller structures provide a more gradual change in the refractive index (from air being unity to membrane with n ≈ 1.5), having the effect of reducing Fresnel reflections. Unlike some open-wing insects that perch on the tips of flora for quick takeoff and rapid escape (14), cicada predator evasion is likely to rely heavily on crypsis from within a canopy. A clear and antireflective coating would thus aid the insect in being unnoticed by predators.
FIGURE 7.
(a) AFM gray-scale image of regions: squares D, E, and F represent depths of removal of 200, 60, and 150 nm, respectively. (b) Optical images in the reflectance mode of the manipulated regions and surrounding intact surface. (c) Reflectance intensity profile of the manipulated regions.
FIGURE 8.
Intensity plot of reflectance measurements after AFM modification of the cuticle surface.
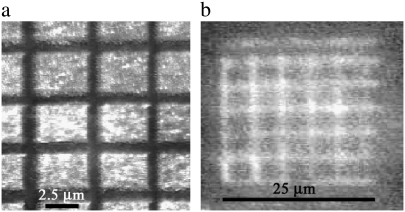
The images in Fig. 9 illustrate lithographic patterning by selective removal of structures. The resultant architecture consists of a grid pattern resulting in a reflectance pattern with the grid structure. Similar grid patterns have been produced by nanomachining the structures beyond the wavelength of the visible spectrum with the removal of material on the scale of single nanostructures in the array.
FIGURE 9.
(a) AFM gray-scale image of a lithographic grid pattern region on a cicada membrane. (b) Optical reflectance image of the grid pattern formed on the membrane.
Wetting, adhesion, and surface contamination
The wettability of a cicada membrane (A. curvicosta) is shown in Fig. 10 a. It is evident from the image that the water droplet gains negligible energy through absorption to compensate for any enlargement of its surface area. The measured contact angle was 144° ± 7°. A comparison with polydimethylsiloxane (PDMS), a well-known hydrophobic surface (with a measured contact angle of ∼101°, in good agreement with values reported in the literature (32)), highlights the hydrophobic character of the membranes (see Fig. 10 b). PDMS superhydrophobic surfaces have been tailored by transferring lotus-type structures by a templating procedure. Indeed, it has been suggested in an earlier study (19) that cicada wings could also be adopted as natural templates for tailored polymer surfaces. A PDMS surface formed from a resin replica of a cicada wing illustrates the increased hydrophobicity when roughness is introduced to the polymer surface (see Fig. 10 c). (The area of the fabricated replica is restricted to the wing dimensions and will include the imprints of the vein structures.)
FIGURE 10.
Optical images of (a) a 10-μl drop of water on a cicada membrane (A. curvicosta), (b) a similar drop on a hydrophobic polymer surface (polydimethylsiloxane), and (c) a polydimethylsiloxane surface that has been formed by exposure to a resin replica of the cicada wing.
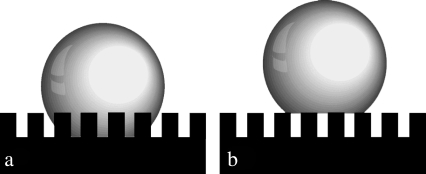
Two different theories purport to describe the effect of surface roughness on hydrophobicity. The theory by Wenzel (33) makes the assumption that, when a liquid drop is placed on a surface consisting of protrusions, the liquid will fill the open spaces, as shown in Fig. 11 a. This model predicts that roughness of the surface reinforces both hydrophobicity and hydrophilicity. Cassie and Baxter (34), on the other hand, consider the microstructures to be a heterogeneous surface composed of solid and air. The crucial assumption is that the asperities will remain filled with air, thereby allowing the drop to sit on top of the surface as shown in Fig. 11 b.
FIGURE 11.
Diagram showing the interaction of bulk water with a structured surface according to the (a) Wenzel (33) and (b) Cassie-Baxter (34) models.
The Cassie-Baxter and Wenzel models describe static droplets at equilibrium and allow calculation of the contact angle for the two conditions. For an array of hemispherical-top protrusions, the corresponding equations for the contact angle are
 |
(3) |
 |
(4) |
where φB is the ratio of the basal area of the protrusion over the total area, φB is the solid fraction of protrusions with  d is the diameter of the base of the protrusions, h is the structure height, and l is the center-to-center pitch (nearest-neighbor spacing for an ordered array). θY is the ideal contact angle of water on a smooth surface of identical chemistry (θY = 105° is an appropriate estimate in the current case (31,35,36)). The predicted contact angles for the cicada membrane are 143° and 150° for the Wenzel and Cassie-Baxter models, respectively. Either value correlates well with the experimentally determined value. A recent study of fabricated superhydrophobic nanostructures with comparative spacing and height to the cicada arrays reported measured values of contact angle similar to our results (37).
The work of adhesion can be approximated by the Young-Dupré equation
 |
(5) |
where γ for water is 72.8 mJ/m2. With a contact angle of 144° the calculated adhesion will be <14 mJ/m2. This value represents the work required per unit area to separate the water and solid (cuticle) phases. For comparison, the work of adhesion for water on a silica (glass) surface is ∼120 mJ/m2 (38). The wing membrane was also examined with two other liquids for a more accurate determination of the surface energy. This was carried out by solving a simple matrix utilizing three testing liquids with known properties and applying Wenzel's roughness model (39,40). The surface energy of the membrane using this approach yielded a value of ∼15 mJ/m2 in good agreement with the value determined using the Young-Dupré equation. The relatively weak interaction between the droplet and the cuticle is consistent with the ability of the water to minimize its energy configuration by attracting surface contaminants when it beads off the membrane surface. Significant quantities of liquid excrement have been observed on specimens collected from the large resident cicada populations (e.g., A. curvicosta). Indeed because of population numbers concentrated into small areas, a copious amount of surplus plant sap excrement constitutes what is known as “cicada rain”. Thus, the cicadas must cope with a liquid-rich environment presented by artificial rain conditions. Droplets of excrement exhibit contact angles similar to those measured with Milli-Q water. Thus, droplets of liquid waste can easily be removed from the dorsal and ventral sides of the wing membranes, reducing wing contamination. Indeed, this process may aid in removing foreign particles from the ventral side where normal rainfall may not come into contact.
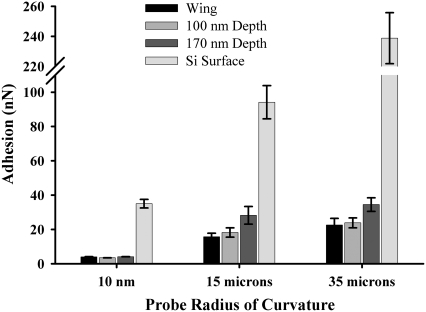
Wetting properties and adhesion of contaminant particles coming into contact with the cuticle surface (A. curvicosta) were investigated with “model” particles: silica spheres of diameters in the range ∼10–40 μm were attached to the AFM probes. This system represents a high-energy surface contaminant particle coming into contact with a low-energy hydrophobic nanoarray. Fig. 12 shows the results for adhesion of particles of varying dimensions. For comparison, adhesion on a silica surface (Si wafer with a native oxide layer of a few nanometers) is also shown. In this case the meniscus force at the point of contact between the tip/particles and the SiO2 surface accounted for the high adhesive forces. The meniscus force between a sphere and a flat surface can be expressed as a function of contact angle and other parameters (41):
 |
(6) |
where R is the radius of the tip/particle, and γ the surface energy (0.0728 J/m2 for water) of the liquid film. The predicted force of adhesion for the hydrophilic AFM tip interacting with the hydrophilic silica surface is ∼20 nN, in reasonable agreement with the measured value of ∼26 nN. The values calculated from Eq. 6 for the larger spheres yield much larger adhesive forces than were observed experimentally. Because the particles have surface roughness on the nanometer scale, as observed by AFM imaging, contact with the flat surface is made via a number of contact points, i.e., a multiasperity regime, each with radii of curvature in the nanometer range.
FIGURE 12.
Data for force of adhesion on an intact region of the membrane surface and for manipulated (crushed) regions (100 and 170 nm deep as measured from original height of nanostructure) corresponding to removal of silica particles of 13 and 40 μm diameters and of an oxidized Si AFM-tip with a radius of curvature of ∼20 nm. The error bars represent the 95% confidence limits.
Particle adhesion on the nanoarray is extremely small in comparison with that for a flat hydrophilic surface. Adhesion was almost an order of magnitude lower on the array. Substitution of the adhesion force into Eq. 6 yielded a contact angle of ∼135°. This value is in reasonable agreement with the experimentally determined value carried out using the sessile drop method. The low adhesion value is consistent with other studies on various materials and reflects the low surface energy of the surface (25).
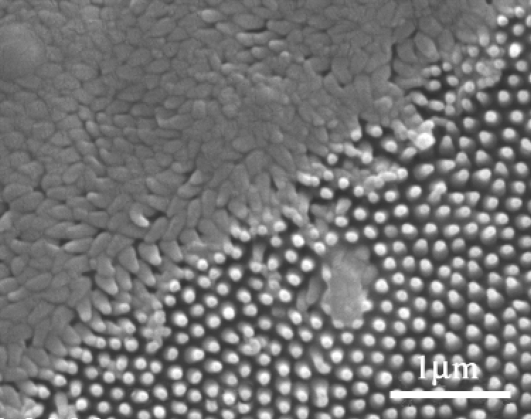
AFM manipulation of the surface by an AFM probe with a tip with a large radius of curvature (∼100 nm) resulted in partial crushing of the array structures as shown in Fig. 13. The crushed array presents a greater contact area for adhering particles, in comparison with the intact array, thus leading to greater adhesion. The results for particles with radius of curvature smaller than that of the array protrusions (i.e., the unmodified AFM tip with a curvature of ∼20 nm) reveal comparable adhesion for both intact and crushed arrays, thus showing that the contact areas were similar and were determined by the topography of the tip (significant chemical changes would most likely manifest in greater differences in adhesion). The fact that the nanostructures are hydrophobic, in combination with limited opportunities for micrometer-sized particles to attach (because of the shape and spacing), suggests that the membrane demonstrates a self-cleaning technology where surface forces are minimized and water meniscus (capillary) forces are significantly reduced or eliminated. This antiwetting and self-cleaning technology would confer additional advantages in addition to the known antireflective function of the array by reducing contamination of the membrane surface.
FIGURE 13.
SEM image of the outer membrane of the cicada wing (A. curvicosta) after deformation showing crushed and intact regions.
CONCLUSION
When cicada nymphs emerge from the ground (after a number of years), they live for varying periods of time, from a few days to a couple of months. The majority live for 2–4 weeks. In this time period, they lay eggs. This part of the cicada life cycle, although very short, is obviously a crucial stage in terms of survival of the species. The antireflectance of the cicada's wing array structure would presumably reduce losses from predators, thus maximizing the mating opportunities and likelihood of procreation of the adult cicada. Contamination of the antireflective coating by water, excrement, or particulates would most likely degrade the optical properties of the wing membrane (e.g., a thin liquid layer would act as the first interface for reflecting light, and particulate contamination would cause diffuse scattering). It has been shown that the cicada wing, presenting a nanometer-scale array structure, can be highly hydrophobic (indeed approaching superhydrophobic), and the protrusions limit the contact area with micrometer-sized particles. Therefore, liquid and solid contaminants are readily removed from the surface during environmental wetting conditions, demonstrating a self-cleaning effect. Other factors such as wing movement and wind shear may also contribute to removal of contaminating particles.
The demonstration that it is possible to tailor reflectance/transmittance by AFM manipulation of nanostructure arrays is another outcome of this study. The technology employed could, in principle, be incorporated into industrial coatings (especially polymer array coatings) as a means of controlling optical properties on the microscale, leading to precise tuning at high spatial resolution.
Acknowledgments
We thank Lindsay Popple from the University of Queensland for helpful discussions.
J.A.W. was funded by the Griffith University Postdoctoral Research Fellowship Scheme.
Editor: Herbert Levine.
References
- 1.Gorb, S. 2001. Attachment Devices of Insect Cuticle. Kluwer Academic Publishers, Dordrecht, The Netherlands.
- 2.Vincent, J. F. V. 2002. Arthropod cuticle: a natural composite shell system. Composites Pt. A. 33:1311–1315. [Google Scholar]
- 3.Vincent, J. F. V., and U. G. K. Wegst. 2004. Design and mechanical properties of insect cuticle. Arthropod StructDevel. 33:187–199. [DOI] [PubMed] [Google Scholar]
- 4.Neville, A. C. 1975. Biology of the Arthropod Cuticle. Springer, Berlin.
- 5.Chapman, R. F. 1998. The Insects: Structure and Function. Cambridge University Press, Cambridge.
- 6.Bernhard, C. G., and W. H. Miller. 1963. Function of corneal nipples in compound eyes of insects. Acta Physiol. Scand. 58:381–382. [DOI] [PubMed] [Google Scholar]
- 7.Gibson, C. T., G. S. Watson, and S. Myhra. 1996. Determination of the spring constants of probes for force microscopy/spectroscopy. Nanotechnology. 7:259–262. [Google Scholar]
- 8.Vukusic, P., and J. R. Sambles. 2003. Photonic structures in biology. Nature. 424:852–855. [DOI] [PubMed] [Google Scholar]
- 9.Grann, E. B., M. G. Moharam, and D. A. Pommet. 1995. Optimal design for antireflective tapered two-dimensional subwavelength grating structures. J. Opt. Soc. Am. A. 12:333–339. [Google Scholar]
- 10.Parker, A. R., Z. Hegedus, and R. A. Watts. 1998. Solar-absorber antireflector on the eye of an Eocene fly. Proc. R. Soc. Lond. B. Biol. Sci. 256:811–815. [Google Scholar]
- 11.Wichard, W., A. Gras, H. Gras, and D. Dreesmann. 2005. Antireflection coating and iridescent colors on the eyes of caddisflies enclosed in amber. Entomol. Gen. 27:223–238. [Google Scholar]
- 12.Yoshida, A., M. Motoyama, A. Kosaku, and K. Miyamoto. 1996. Nanoprotruberance array in the transparent wing of a hawkmoth, Cephonodes hylas. Zool. Sci. 13:525–526. [Google Scholar]
- 13.Yoshida, A., M. Motoyama, A. Kosaku, and K. Miyamoto. 1997. Antireflective nanoprotuberance array in the transparent wing of a hawkmoth, Cephonodes hylas. Zool. Sci. 14:737–741. [Google Scholar]
- 14.Samways, M. J. 2006. Open and banded wings: hypotheses on damselfly wing position (zygopteran). Odonatologica. 35:67–73. [Google Scholar]
- 15.Zheng, L. J., X. D. Wu, Z. Lou, and D. Wu. 2004. Superhydrophobicity from microstructured surface. Chin. Sci. Bull. 49:1779–1787. [Google Scholar]
- 16.Barthlott, W., and C. Neinhuis. 1997. Purity of the sacred lotus, or escape from contamination in biological surfaces. Planta. 202:1–8. [Google Scholar]
- 17.Wagner, T., C. Neinhuis, and W. Barthlott. 1996. Wettability and contaminability of insect wings as a function of their surface sculptures. Acta Zool. 77:213–225. [Google Scholar]
- 18.Reference deleted in proof.
- 19.Watson, G. S., and J. A. Watson. 2004. Natural nano-structures on insects-possible functions of ordered arrays characterized by atomic force microscopy. Appl. Surf. Sci. 235:139–144. [Google Scholar]
- 20.Cong, Q., G.-H. Chen, Y. Fang, and L.-Q. Ren. 2004. Super-hydrophobic characteristics of butterfly wing surface. J. Bionics Eng. 1:249–255. [Google Scholar]
- 21.Reference deleted in proof.
- 22.Gorb, S. N., A. Kesel, and J. Berger. 2000. Microsculpture of the wing surface in Odonata: evidence for cuticular wax covering. Arthropod Struct. Devel. 29:129–135. [DOI] [PubMed] [Google Scholar]
- 23.Tao, Z., and B. Bhushan. 2006. Wetting properties of AFM probes by means of contact angle measurement. J. Phys. D Appl. Phys. 39:3858–3862. [Google Scholar]
- 24.Sedin, D. L., and K. L. Rowlen. 2000. Adhesion forces measured by atomic force microscopy in humid air. Anal. Chem. 72:2183–2189. [DOI] [PubMed] [Google Scholar]
- 25.El Ghzaoui, A. 1999. Determination of surface energy of polymers by force microscopy. J. Appl. Phys. 85:1231–1233. [Google Scholar]
- 26.Cleveland, J. P., S. Manne, D. Bocek, and P. K. Hansma. 1993. A Non-destructive method for determining the spring constant of cantilevers for scanning force microscopy. Rev. Sci. Instrum. 64:403–405. [Google Scholar]
- 27.Gibson, C. T., G. S. Watson, and S. Myhra. 1997. Scanning force microscopy—calibration procedures for ‘best practice’. Scanning. 19:564–581. [Google Scholar]
- 28.Gibson, C. T., G. S. Watson, and S. Myhra. 1997. Lateral force microscopy—a quantitative approach. Wear. 213:72–79. [Google Scholar]
- 29.Watson, G. S., J. A. Blach, C. Cahill, D. V. Nicolau, D. K. Pham, J. Wright, and S. Myhra. 2003. Poly(amino acids) at Si-oxide interfaces—bio-colloidal interactions, adhesion and ‘conformation.’ Colloid Polymer Sci. 282:56–63. [Google Scholar]
- 30.Watson, G. S., J. A. Blach, C. Cahill, D. V. Nicolau, D. K. Pham, J. Wright, and S. Myhra. 2004. Interactions of poly(amino acids) in aqueous solution with charged model surfaces—analysis by colloidal probe. Biosens. Bioelectron. 19:1355–1362. [DOI] [PubMed] [Google Scholar]
- 31.Watson, G. S., S. Myhra, B. W. Cribb, and J. A. Watson. 2006. Imaging and investigation of function(s) and efficiency of ordered cuticular nanostructures. In Nanoscale Structure and Properties of Microbial Cell Surfaces. E. P. Ivanova, editor. Nova Science Publishers, New York. 175–198.
- 32.Rolland, J. P., R. M. Va Dam, D. A. Schorzman, S. R. Quake, and J. M. DeSimone. 2004. Solvent-resistant photocurable “liquid teflon” for microfluidic device fabrication. J. Am. Chem. Soc. 126:2322–2323. [DOI] [PubMed] [Google Scholar]
- 33.Wenzel, R. N. 1936. Resistance of solid surfaces to wetting by water. Ind. Eng. Chem. 28:988–994. [Google Scholar]
- 34.Cassie, A. B. D., and S. Baxter. 1944. Wettability of porous surfaces. Trans. Faraday Soc. 49:546–551. [Google Scholar]
- 35.Gao, X., and L. Jiang. 2004. Biophysics: Water-repellent legs of water striders. Nature. 432:36–38. [DOI] [PubMed] [Google Scholar]
- 36.Tong, J., J. Sun, D. Chen, and S. Zhang. 2005. Geometrical features and wettability of dung beetles and potential biomimetic engineering applications in tillage implements. Soil Tillage Research. 80:1–12. [Google Scholar]
- 37.Martines, E., K. Seunarine, H. Morgan, N. Gadegaard, C. D. W. Wilkinson, and O. Riehle. 2005. Superhydrophobicity and superhydrophilicity of regular nanopatterns. Nano Lett. 5:2097–2103. [DOI] [PubMed] [Google Scholar]
- 38.Sklodowska, A., M. Wozniak, and R. Matlakowska. 1999. The method of contact angle measurements and estimation of work of adhesion in bioleaching of metals. Biol. Proced. Online. 1:114–121. [DOI] [PMC free article] [PubMed] [Google Scholar]
- 39.Olive, J. F., C. Huh, and S. G. Mason. 1980. An experimental study of some effects of solid surface roughness on wetting. Colloids Surfaces A. 1:79–104. [Google Scholar]
- 40.Sinn, G., M. Gindl, A. Reiterer, and S. Stanzl-Tschegg. 2004. Changes in the surface properties of wood due to sanding. Holzforschung. 58:246–251. [Google Scholar]
- 41.Bhushan, B. 2002. Introdcution to Tribology. Wiley, New York.


