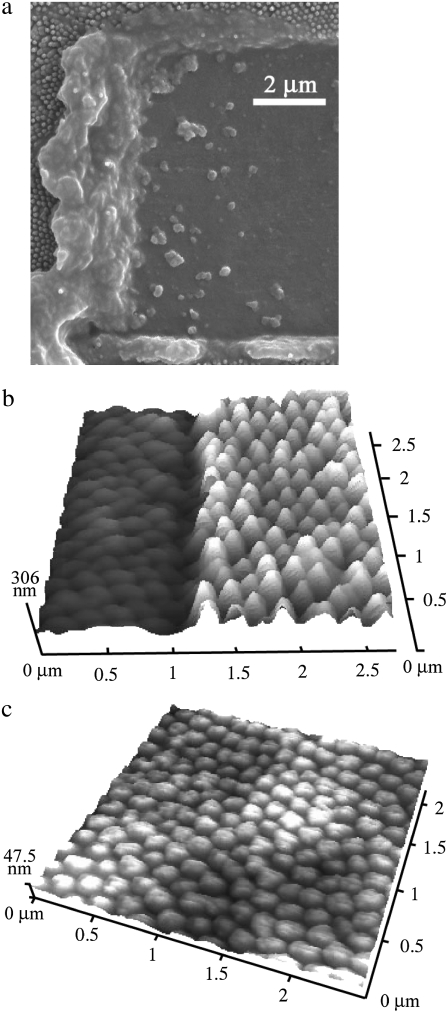
FIGURE 4.
(a) SEM image of a region on a cicada membrane subjected to alteration. (b and c) The removal of material was carried out at an applied force loading of 500 nN and repetitive raster cycles consisting of 500 lines. The images were obtained at low-force loading (7 nN) in the contact mode. The high-resolution images show altered regions resulting from removal of material to a depth of 120 nm (region showing excavated and intact sections) and 180 nm, respectively.

