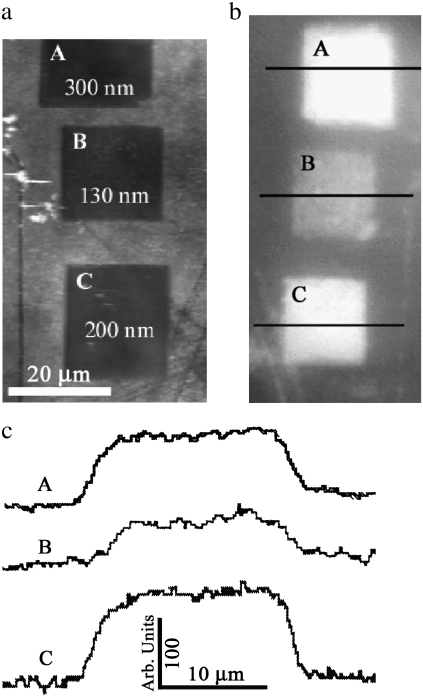
FIGURE 6.
(a) AFM gray-scale image of regions after alteration: squares A, B, and C correspond to depths of removal of 300, 130, and 200 nm, respectively. (b) Optical images in reflectance mode of the manipulated section and surrounding intact region. (c) Reflectance intensity profiles of the manipulated regions.

