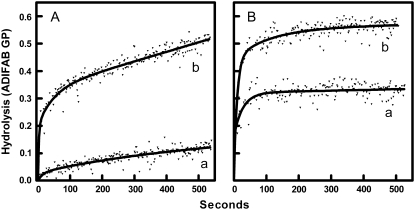
FIGURE 1.
Effects of MBCD and ionomycin treatment on the time course of membrane hydrolysis by sPLA2. (A) Erythrocytes were treated with MBSS (curve a) or MBCD (curve b). Samples were then washed and incubated with ADIFAB and DMSO at 37°C as explained in Materials and Methods. The origin on the graph corresponds to the addition of sPLA2. Fatty acid release is expressed in GP units (i.e., representing the degree of change in ADIFAB fluorescence). Curves represent nonlinear regression fits of the data using an arbitrary function consisting of the sum of two exponential functions. (B) The experiments of panel A were repeated with ionomycin instead of DMSO.

