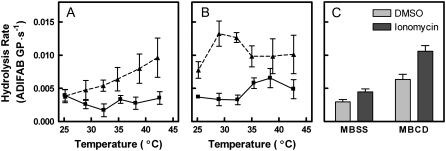
FIGURE 2.
Effects of temperature on rate of hydrolysis by sPLA2. The experiments of Fig. 1 A (DMSO; shown in panel A) and B (ionomycin; shown in panel B) were repeated at the multiple temperatures indicated for control cells (squares, solid lines) and for cells treated with MBCD (triangles, dashed lines). The initial rate of hydrolysis was estimated by nonlinear regression as described in Materials and Methods. (C) Data from all temperatures were pooled and analyzed by two-way analysis of variance to assess the contributions of ionomycin (9.8% of variation, p < 0.0001), MBCD (26% of variation, p < 0.0001), and interaction between the two (2.2% of variation, p = 0.03), n = 5–7 per temperature.

