FIGURE 7.
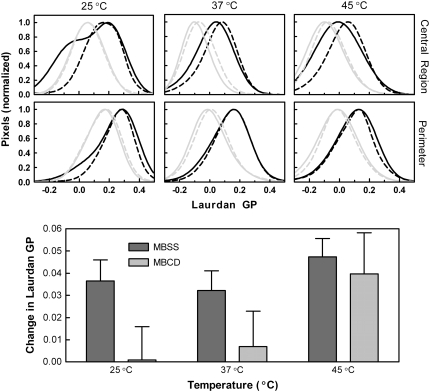
Effect on ionomycin treatment on laurdan GP in control and MBCD-treated samples. (Upper two rows of panels) Laurdan GP was assessed from two-photon images as in Fig. 5 for control and MBCD-treated samples before and after addition of ionomycin. Histograms of the central region and perimeter of the cells at 25°C, 37°C, and 45°C were calculated from the images as described in Materials and Methods. These histograms were then fit by nonlinear regression (arbitrary function) and normalized. Control cells (MBSS-treated) are represented in black and MBCD-treated cells are represented in gray with the lighter, dashed lines corresponding to cells after ionomycin treatment. (Lower panel) The average change in laurdan GP after ionomycin treatment at 25°C, 37°C, and 45°C is shown for both control and MBCD-treated cells. Data from images (250 nM laurdan, n = 3 in each group) and bulk samples using fluorescence spectroscopy (250–460 nM laurdan; n = 9) have been pooled. Two-way analysis of variance showed the effects of cholesterol depletion (5.8% of variation, p = 0.04), temperature (5.9% of variation, p = 0.11), and interaction between the two (1.5% of variation, p = 0.57).

