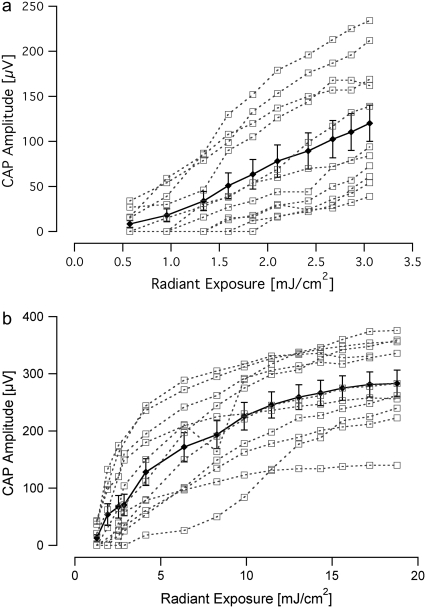
FIGURE 3.
Input/output curves recorded in response to laser stimulation. (a) The data show the amplitude of the evoked compound action potential as the input radiant exposure is varied for a 5-μs-long optical pulse. There is a monotonic increase in evoked CAP amplitude with increasing radiant exposure. (b) The I/O function for a 30-μs-long pulse reveals a monotonic increase in CAP amplitude with increasing radiant exposure, followed by an apparent plateau in CAP amplitude above ∼15 mJ/cm2. In both panels, data from individual animals (n = 11) are represented by open squares and the mean is shown with the standard error.

