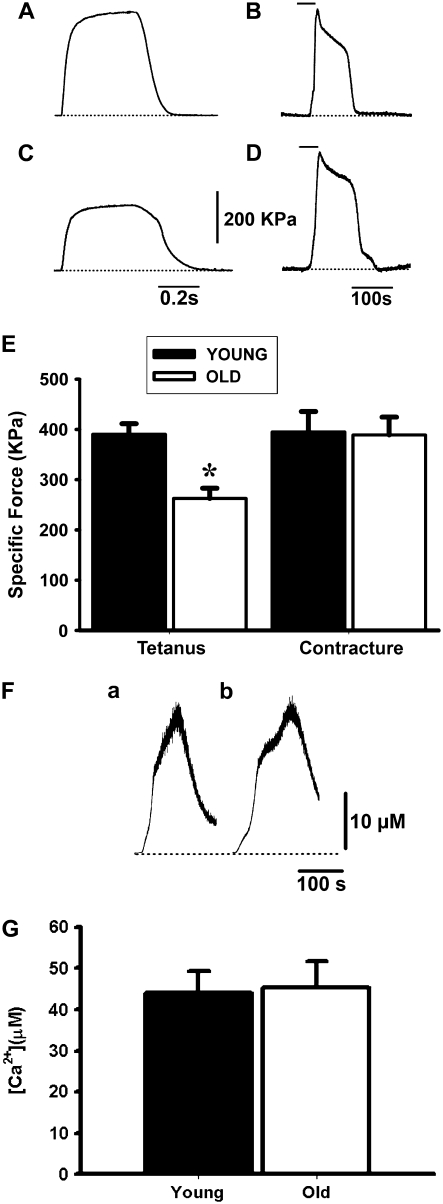
FIGURE 2.
Tetanus and 4-CmC contracture in FDB fibers. (A and C) Tetani recorded in single intact FDB fibers from young (A) and old (C) mice in response to a 350-ms-duration pulse (electrical field stimulation) at a frequency of 100 Hz. (B and D) 4-CmC contractures in fibers from young (B) and old (D) mice. The horizontal line above the curve indicates exposure time to the drug, and the dotted line is the baseline. (E) Specific force for tetanus and contracture in fibers from young and old mice expressed in kPa (mean ± SE). The asterisk indicates a statistically significant difference in tetanus between age groups and between tetanus recorded in old mice compared to 4-CmC contractures in fibers from both young and old mice. (F) Intracellular Ca2+ transients evoked by 1 mM 4-CmC in fibers from young (a) and old (b) mice. The bars above indicate the time the fiber was exposed to the drug. (G) Statistical analysis of the peak intracellular Ca2+ concentration recorded in fibers from young (n = 8 fibers) and old (n = 7 fibers) mice.

