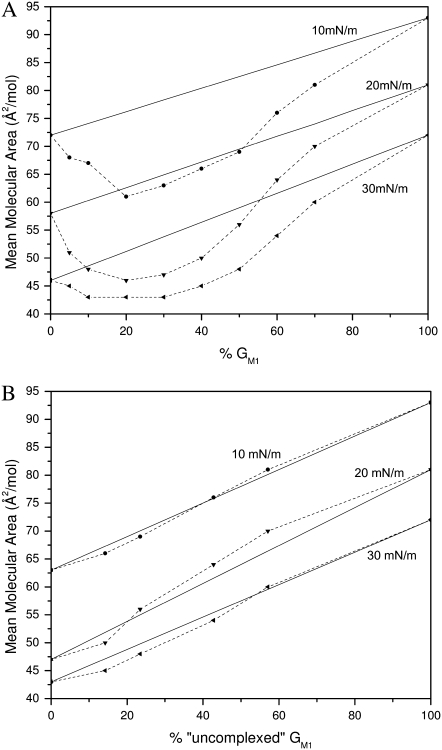
FIGURE 3.
Mean area per molecule in mixed monolayers of DPPC and GM1 at surface pressures of 10, 20, and 30 mN/m. The solid lines represent values calculated by the additivity rule and correspond to ideal mixtures. Dashed lines are added to guide the eye. (A) Mean area per molecule plotted as a function of the percentage of GM1 in the monolayer. (B) Mean area per molecule assuming that 7:3 DPPC/GM1 and GM1 are the “pure” components plotted as a function of “uncomplexed” GM1. See text for details.

