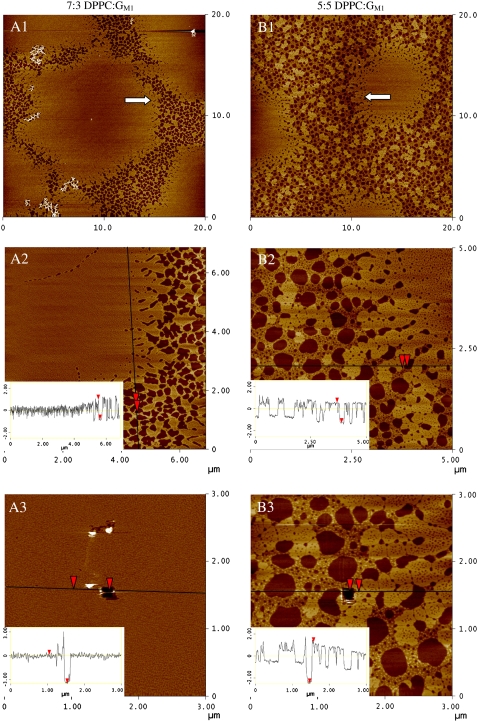
FIGURE 7.
AFM topographic images of (A) 7:3 and (B) 5:5 DPPC/GM1 monolayers transferred at 30 mN/m (z-scale 5 nm). (1) Global morphology. (2) Image recorded by zooming into the region at the edge of a condensed domain marked with an arrow in image 1. Section analysis insets show relative height differences among membrane components. (3) Region in middle (A) or edge (B) of condensed domain. The dark hole is a scratched area where the local material was removed by rapidly scanning (20 Hz) a 150 nm square at high force with the AFM tip. Resulting section analysis insets indicate the total height of the monolayer components.

