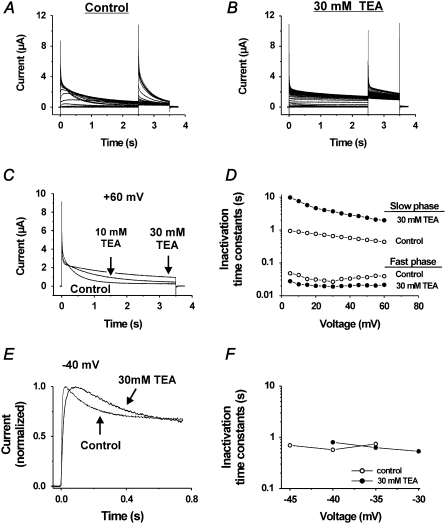
FIGURE 6.
Effects of TEA on the inactivation components induced at high voltages. (A and B) Currents at steps between −80 and +60 mV from a holding voltage of −80 mV and a subsequent step to +40 mV in control (A) and 30 mM TEA (B). (C) Superimposed currents at +60 mV in varying concentrations of TEA, highlighting the decreased inactivation in high TEA concentration. (D) Effect of 30 mM TEA on time constants of the fast and slow inactivation components plotted versus voltage in the range from +5 to +60 mV, showing the difference in TEA effect on the two components. (E) Effect of 30 mM TEA on the current associated with a step to −40 mV. (F) Effect of 30 mM TEA on the inactivation time constant versus voltage curve.

