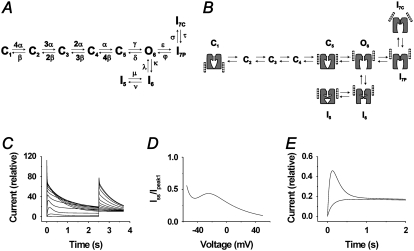
FIGURE 8.
Kinetic modeling of the I470Y mutant. (A) The kinetic scheme used for the calculations. C denotes closed states, O an open state, and I inactivated states. Rate constant symbols indicated. See Table 1 for parameter values. (B) Schematic structural model of the kinetic model, showing hypothetical movements of voltage sensors, selectivity filter, and internal gate. The different positions of the voltage sensors in IC7 and IP7 are based on a scenario suggested by Loots and Isacoff (16). (C) Calculated time evolution of the model current at voltage steps in increments of 10 mV followed by a step to +40 mV (cf. Fig. 3 A). (D) Calculation of Iss/Ipeak1 from C (cf. Fig. 4 C). (E) Calculation of currents associated with two consecutive steps to −40 mV from a holding potential of −80 mV. The traces are superimposed to illustrate that the channel model is trapped in an inactivated state (cf. Fig. 5 A).

