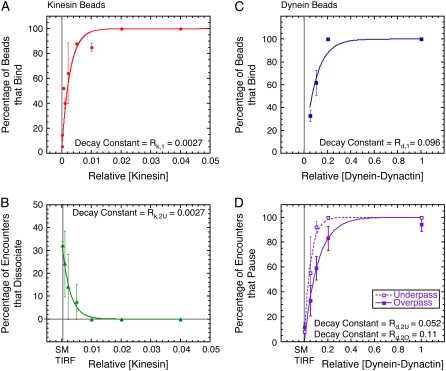
FIGURE 5.
Comparison of binding statistics and actions at intersections for kinesin- and dynein-dynactin-coated beads. (A) Percentage of kinesin-coated beads that bound microtubules (red circles) as a function of relative kinesin concentration and fit to the data (red line, χ2 = 22.6). (B) Percentage of kinesin beads that dissociated at the intersection from the underpass (green triangles) as a function of relative kinesin concentration and fit to the data (green line, χ2 = 0.001). (C) Percentage of dynein-dynactin beads that bound microtubules (blue squares) as a function of relative dynein-dynactin and fit to the data (blue line, χ2 = 217). (D) Percentage of dynein-dynactin beads that paused at the intersection from the underpass (open squares) and overpass (solid squares) as a function of relative dynein-dynactin concentration and fits to the data for underpass (dashed line, χ2 = 0.016) and overpass (solid line, χ2 = 0.018). For panels A, C, and D, the fit equation is p = 100 × (1 − exp(−[Motor]/R)), where R is the fit parameter given in the panel. For panel B, the fit equation is: p = pmax × exp(−[Motor]/R), where R is the fit parameter given in the panel.

