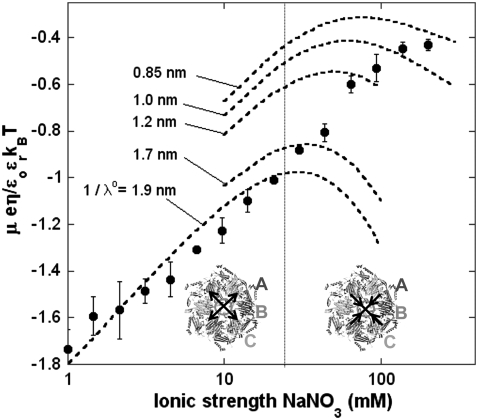
FIGURE 10.
Measured electrophoretic mobility  for bacteriophage MS2 as a function of NaNO3 electrolyte concentration at pH = 7 (solid circles) and theoretical predictions for various values of
  (dashed lines). See text for further detail. In inset, the morphological unit composed of three proteins A, B. and C with the arrows that indicate the modulations of the pore size as governed by the electrolyte concentration level. For the modeling, Eqs. 1–10 and 12–34 are used with the
  and
and  as reported in Tables 1 and 2.

