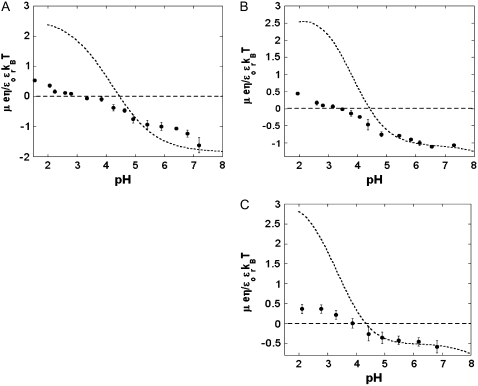
FIGURE 11.
Measured electrophoretic mobility  (solid circles) for bacteriophage MS2 as a function of pH for NaNO3 electrolyte concentration 1 mM (panel A), 10 mM (panel B), and 100 mM (panel C) and theoretical predictions (dashed lines) with the values of
  as derived from Fig. 10 (
 for
for  and
and  mM and
  for
for  See text for further detail.

