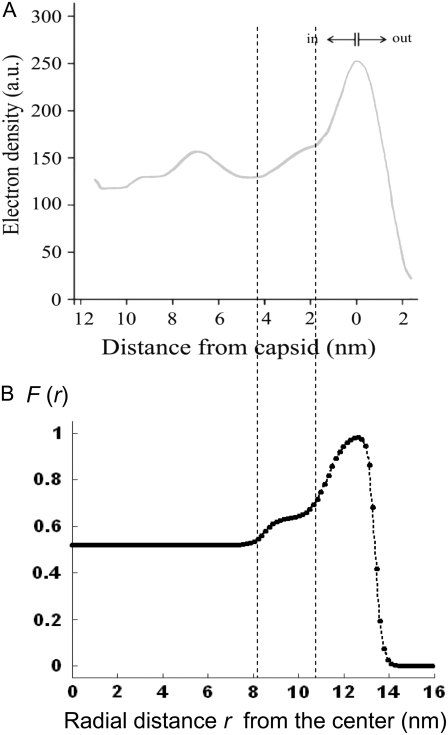
FIGURE 2.
Reconstruction (panel B) of the radial density distribution as derived from cryoEM data (panel A, adapted from Fig. 3 in van den Worm (42)) on the basis of Eqs. 4, 6, and 7. The data are normalized with respect to the largest proteic capsid density (outer shell of the virus). See text for further detail. The dashed lines mark the spatial transitions among the inner RNA, RNA protein-bound layer, and proteic capsid.

