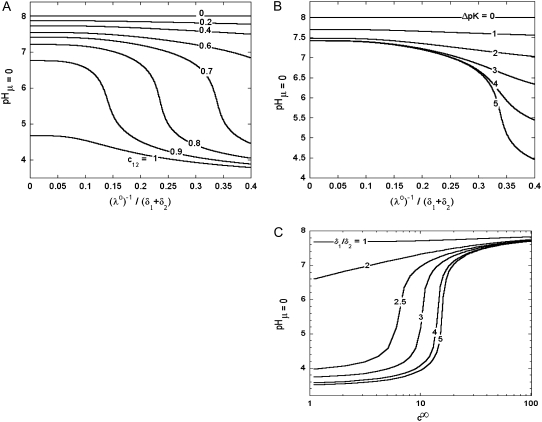
FIGURE 8.
Variation of the isoelectric point as a function of the flow penetration degree, for various values of the nominal charge density ratio  for layers 1 and 2 (panel A) and different values of
  (panel B). Model parameters, panel A:
  and
and  Model parameters, panel B: the same as in A with
  and variable
  (C) Variation of the isoelectric point as a function of the electrolyte concentration and the ratio
  Model parameters, panel C: as in A with
  nm,
nm,  In all these calculations, Eqs. 35–46 are used (particle composed of two concentric soft layers, Eq. 46).

