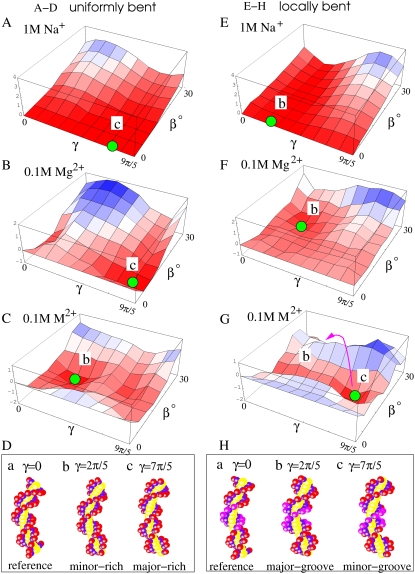
FIGURE 3.
The three-dimensional plot for the electrostatic bending free energy landscapes ΔGE(γ, β) (in kBT) for uniformly bent (A–C) and locally bent (E–G) DNA helices with different bending configurations (γ, β) in a solution of 1 M Na+ (A and E), 0.1 M Mg2+ (B and F), and 0.1 M small divalent ions (M2+) with radius 3.5 Å (C and G). The red and blue colors represent the low and high free energies, respectively. The green circles denote the free energy minima at the landscapes, and the red curve (with arrow) denotes the switch between alternative favorable bending modes. (D and H) The illustrations for the bent DNA helix structures in typical bending directions (γ), where β = 25°. Note that γ = 2π/5 (7π/5) is the minor-groove-rich (major-groove-rich) bending direction for the uniform bending mode and is the major (minor)-groove bending direction for the localized bending mode.

