Figure 3.
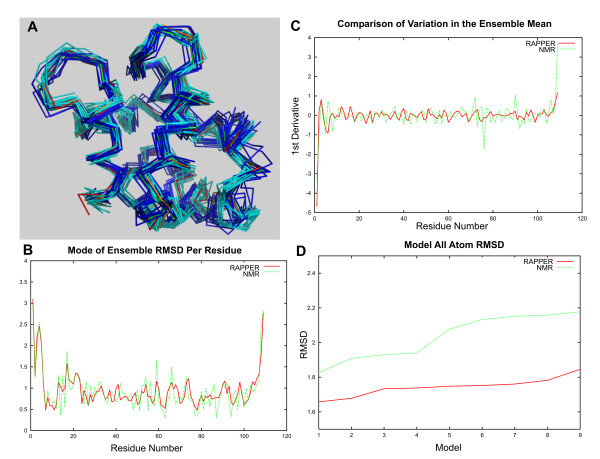
Comparison of RAPPER and NMR Ensembles to the Crystallographic Model. Comparison of a RAPPER ensemble of comparative models for the target 1PVA chain A from the Parvalbulmin family with an NMR ensemble, the crystal structure and the deposited representative NMR structure. A: The backbone trace of 9 models from the RAPPER ensemble (cyan) generated by comparative modelling on all targets and the equivalent models generated by NMR (blue). Also shown are the deposited crystal structure (red) and the representative NMR single model (orange). All models are superimposed with reference to the crystal structure. B: The plot of ensemble mean and mode for each residue in the RAPPER ensemble. C: The 1st derivative of the per residue ensemble mean for RAPPER (red) and the NMR ensemble (green). D: The all atom per residue RMSD for the RAPPER representative single model (red) compared to the equivalent single NMR representative model (green).

