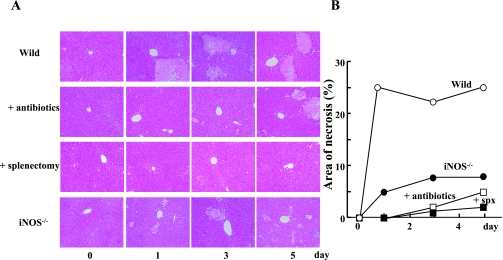
Fig. 3.
Histological examination of liver specimens after BDL. At the indicated times after BDL, the liver specimens were obtained, fixed with 10% formalin, and embedded in paraffin. Thin sections of the liver specimens were stained with hematoxylin-eosin (A). Area of necrosis was determined by using a Image J Software and expressed as % of total area (B). Statistical difference between control (BDL alone) and experimental groups is analyzed by Student’s t test. *p<0.05. All symbols and other conditions were as in Fig. 1. Scale bar = 100 µm.

