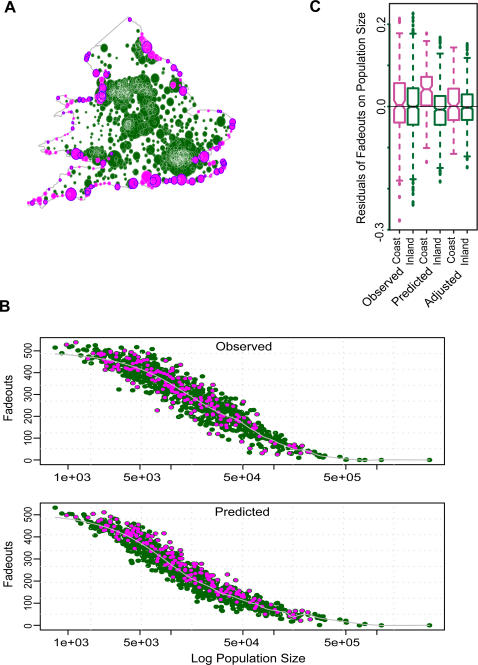
Figure 2. The model predicts more coastal fadeouts than observed for England and Wales.
(a) Map of England and Wales showing the location of each of the 952 towns included in this study. Green circles with white outlines are inland towns, pink circles are coastal towns. Area of each dot is correlated to population size. (b) Total number of fadeouts against population size as observed (top) and as predicted by gravity model (bottom). In the data, the coastal fadeouts (pink) are distributed among the inland fadeouts (green). In the model predictions, the coastal fadeouts are clustered near the top of the inland distribution. (c) Boxplots showing coastal (pink) and inland (green) pairs of residuals of fadeouts on population size. Left: observed; center: gravity model predictions; right: gravity model predictions with spatial coupling increased for the entire coast.

