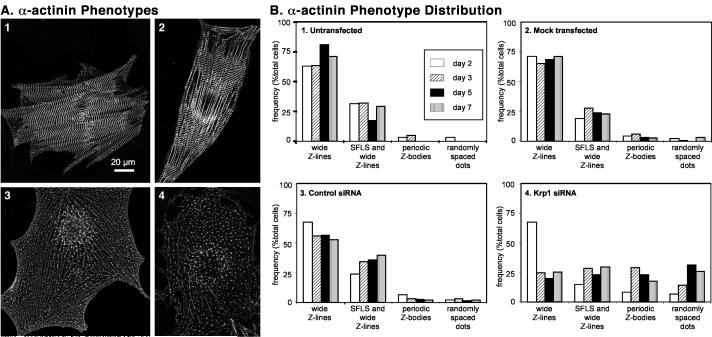
Figure 7.
Classification of cardiomyocytes according to α-actinin organization. Each cardiomyocyte was classified into one of four categories of α-actinin organization corresponding to the dominant phenotype observed by visual inspection. (A) Prototypical examples of α-actinin phenotypes in cultured cardiomyocytes. panel 1: wide Z-lines; panel 2: SFLS and wide Z-lines; panel 3: periodic Z-bodies; panel 4: randomly spaced dots. Panels 1 and 2 are untransfected cells, and cells in panels 3 and 4 were transfected with Krp1 siRNA. After Krp1 siRNA transfection, many cardiomyocytes are almost completely filled with long series of α-actinin dots resembling periodically-spaced Z-bodies or myofibrillogenesis intermediates (panel 3), or are filled with more randomly arranged dots of α-actinin (panel 4). (B) Prevalence of α-actinin phenotypes in cardiomyocytes. Cardiomyocytes were fixed at various times after transfection and analyzed by α-actinin immunostaining and confocal microscopy. Each bar represents the number of cells in the indicated category as a percentage of the total number of cardiomyocytes examined. Panel 1, Untransfected cardiomyocytes: N=120 cardiomyocytes scored from 5 independent experiments. Panel 2, Mock-transfected cardiomyocytes: N=480 cardiomyocytes scored from 10 independent experiments. Panel 3, Control siRNA-transfected cardiomyocytes: N= 355 cardiomyocytes scored from 9 independent experiments. Panel 4, Krp1 siRNA-transfected cardiomyocytes: N=548 cardiomyocytes scored from 11 independent experiments. Cardiomyocytes transfected with Krp1 siRNA were always evaluated in parallel with replicate samples of mock-transfected and/or control siRNA-transfected cells in each experiment.

