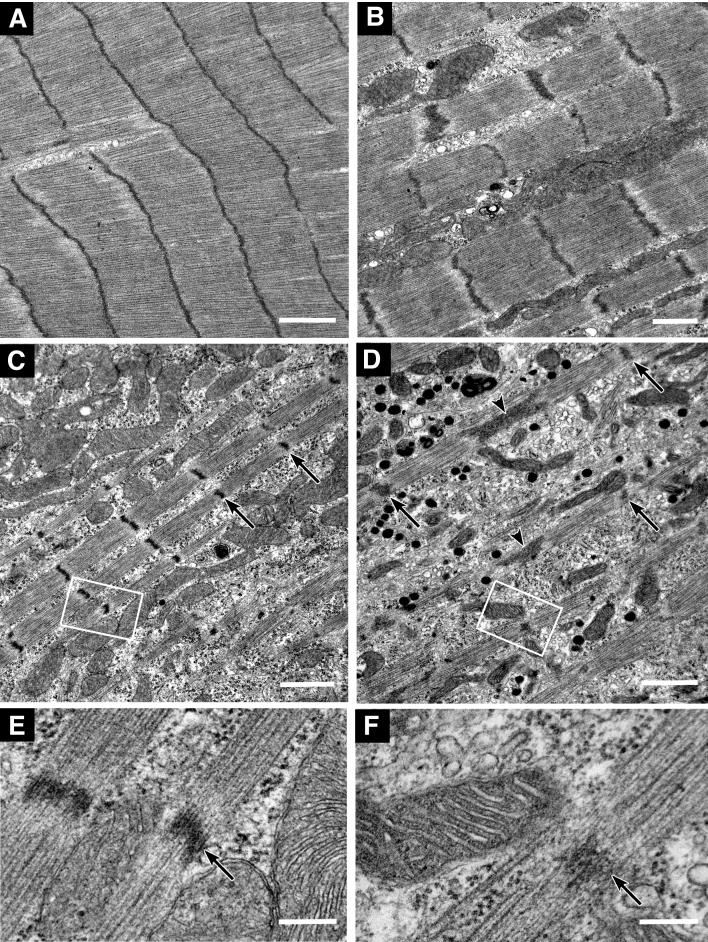
Figure 9.
Electron micrographs showing examples of myofibrillar structure and organization in control siRNA transfected (A), untransfected (B), and Krp1 siRNA transfected (C-F) cardiomyocytes. Cells were fixed 3 days (A, C, E) or 7 days (B, D, F) after transfection. High magnification micrographs of the boxed areas in (C) and (D) are shown in (E) and (F), respectively. In Krp1 siRNA transfected myocytes, myofibrils are thinner and sparser than in controls. Wide contiguous Z-lines such as in (A) are seldom observed. However, the Z-lines (arrows), thick filaments and thin filaments are organized into normal sarcomeres, and the space between myofibrils remains filled with organelles such as mitochondria, polyribosomes and endoplasmic reticulum that appear normal in structure. Arrowheads in (D) indicate abnormally long Z-lines that further suggest immature myofibrillar structure. The myocyte shown in (D) also has numerous dense membrane-bound granules 100-200 nm in diameter, resembling atrial natriuretic peptide secretory granules. Scale bars = 1 μm (A-D) and 0.2 μm (E, F).

