
Figure 4. L pectinata HbIII mRNA tissue distribution.
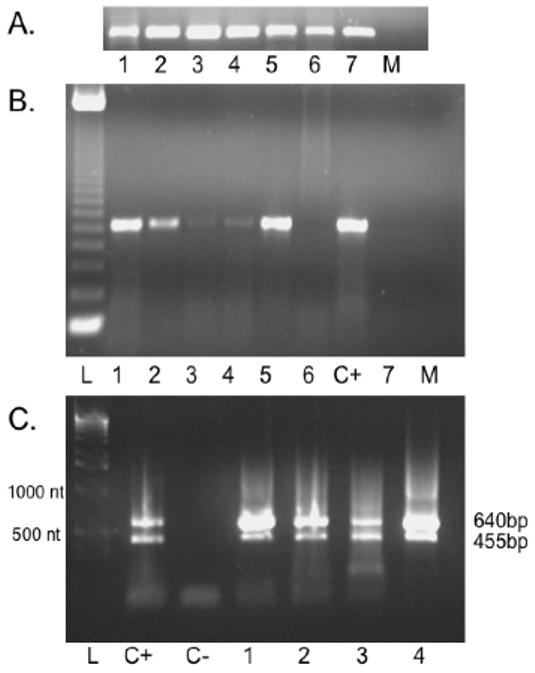
A. RT-PCR for 28S rRNA. Internal loading control detected similar levels of starting RNA in each lanes B. RT-PCR products. The tissue distribution of the Lucina pectinata HbIII mRNA was determined using RT-PCR using the HbIIImRNAF1 and HbIIImRNAR2 primers to amplify a 673 bp cDNA fragment. Lane L: 123 bp DNA ladder, Lane 1: mantle, Lane 2: adductor muscle, Lane 3: foot, Lane 4: pericardial sac, Lane 5: ctenidia, Lane 6: gonad and intestine, Lane C+: Positive Control (ctenidia RNA), Lane 7: digestive gland, Lane M: Mock (human mRNA) C. 1% Agarose Gel Electrophoresis of 3′ PCR-RACE products. RACE reactions were carried out as described in section 2.2. Lane L:1 kb bp DNA Ladder, Lane C+: Positive control, Lane C-: Negative control (no RNA), Lane 1: mantle, Lane 2: adductor muscle, Lane 3: foot, Lane 4: ctenidia