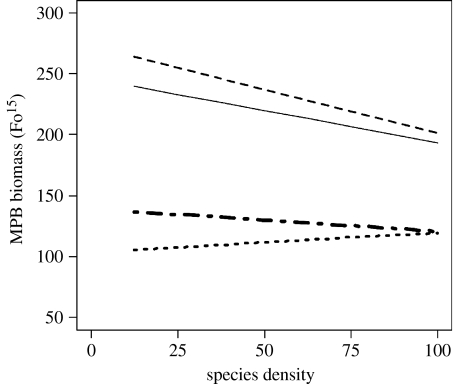
Figure 4.
Graphical representation of the effect of the two-way interaction term interface×species density. Lines represent heterogeneity: E|E (solid line); E|NE (dashed line); NE|NE (dotted line); and NE|E (dot-dashed line), where E is an enriched patch, NE is a non-enriched patch and ‘|’ is the interface between each patch. Analysis is based on the left patch and coded for neighbouring patch on the right. Species density is a percentage of the natural densities found at the study site. As the GLS framework allows for different spreads in the data, individual data points are omitted to prevent misinterpretation.

