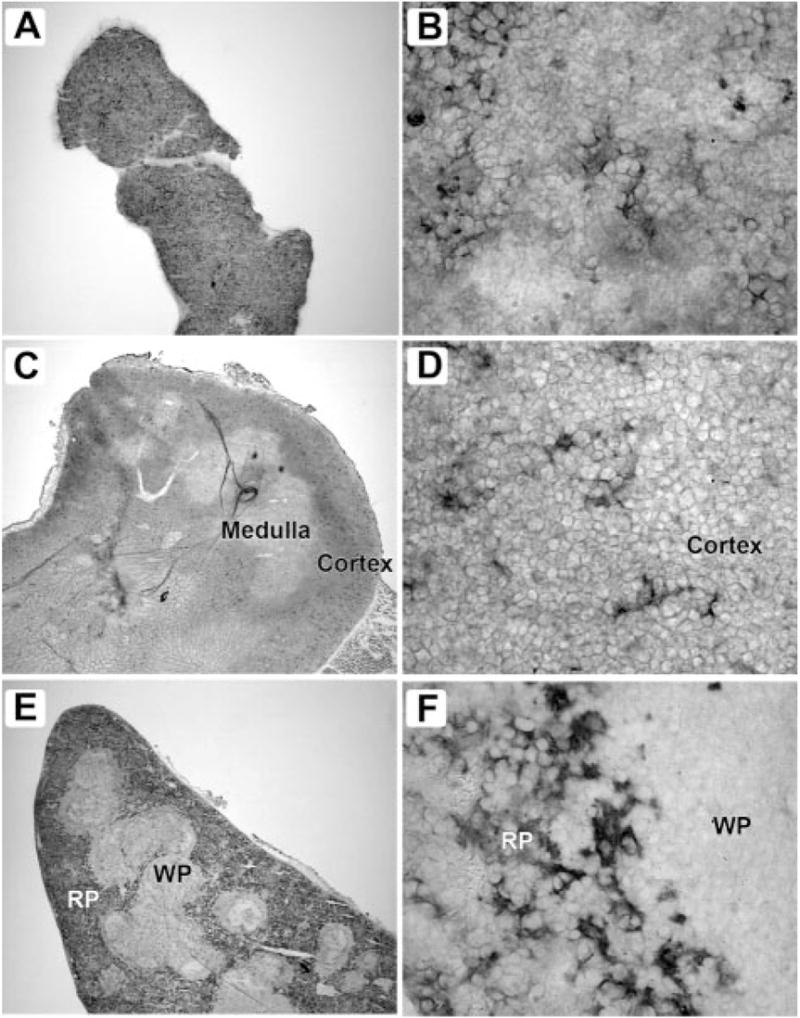
FIGURE 2.

αDβ2 is expressed by distinct populations of macrophages in bone marrow, thymus, and spleen. Frozen sections of freshly isolated tissues were stained with mAb 205c using an immunoperoxidase detection method. Tissues from 8- to 12-wk-old C57BL/6 mice were frozen in Tissue-Tek (Sakura Finetek) and 8-μm cryostat sections were deposited on Superfrost Plus slides (Fisher Scientific). The sections were then fixed in cold acetone for 10 min. Endogenous tissue peroxidase was eliminated by incubation with 0.01% hydrogen peroxide for 15 min. The sections were blocked by incubating with 5% normal goat serum, 1% BSA and avidin solution (Vector Laboratories) for 30 min, and primary Abs (hamster mAbs 205c or 279f raised against mouse αD) were applied to the slides and incubated overnight at 4°C. A secondary Ab (biotin-conjugated goat anti-hamster; Jackson ImmunoResearch Laboratories) was applied at a 1/1000 dilution and incubated for 30 min. Negative controls were performed by omitting the primary Ab or by applying an irrelevant isotype-matched primary Ab as a control. ABC reagent was prepared according to the manufacturer’s instructions (Vector Laboratories) and applied to the sections for 30 min. Staining was developed using a NovaRed kit (Vector Laboratories), followed by counterstaining with Gill’s hematoxylin, dehydration, and mounting using Cytoseal 60 medium (VWR). In each pair of figures, the panel on the left is magnified ×40 and on the right ×800. These distributions of αD are representative of multiple studies. A and B, Bone marrow; C and D, thymus; E and F, spleen; WP, white pulp; RP, red pulp.
