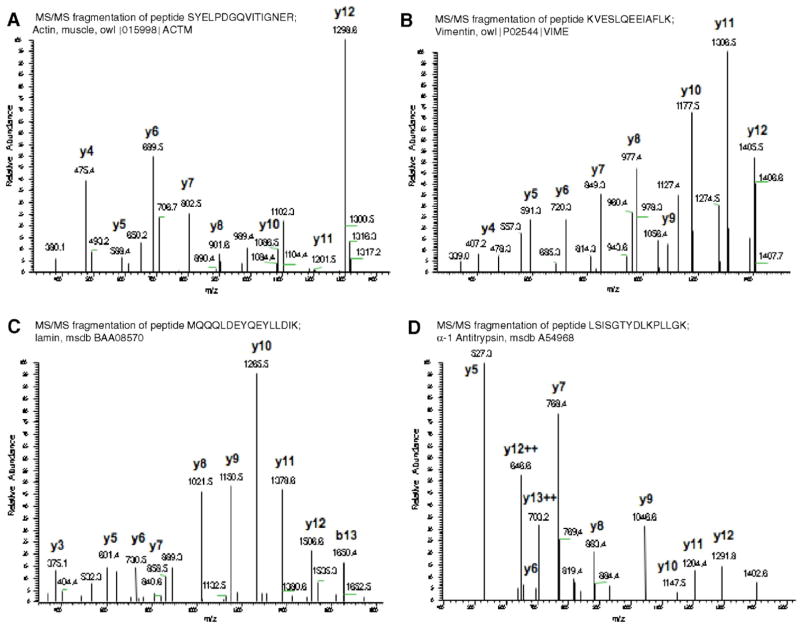
Fig. 5.
The expression of α-actin, vimentin, lamin A, and α-1-antitrypsin is increased in vessel walls following angioplasty. Tryptic maps from nanospray tandem mass spectrometry generated from protein spots in Fig. 1. The proteins were subsequently identified using MS-Tag database search as described in Materials and methods. The tryptic map for analysis for A, α-actin; B, vimentin; C, Lamin A; D, α-1-antitrypsin are shown. Proteins for each analysis were generated from 5 independent experiments, subsequently pooled, and analyzed as shown in the figure.

