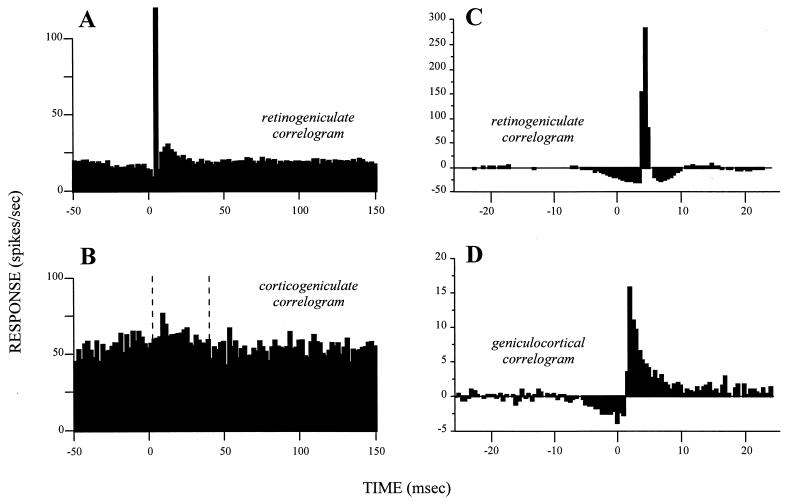
Figure 2.
Cross-correlograms displaying the difference between drivers and modulators. Each is based on simultaneous recordings in cats from two neurons, one presynaptic to the other. The cross-correlograms represent the firing of the postsynaptic cells relative to a spike at time zero for the presynaptic cell. (A) Retinogeniculate cross-correlogram based on spontaneous activity in both the retinal and geniculate neurons. Note the narrow peak rising out of a flat, low baseline that marks this as a driver connection. Redrawn from Fig. 3A of ref. 14, with permission of the publisher. (B) Corticogeniculate cross-correlogram based on spontaneous activity in both the layer 6 cell in area 17 and geniculate neuron. Glutamate was applied to the cortex to enhance the spontaneous firing of the afferent cell. Between the vertical, dashed lines, it is possible to discern a very gradual, prolonged, and small peak arising from a noisy, high baseline that marks this as a modulator connection. Redrawn from Fig. 2A of ref. 42, with permission of the publisher. (C and D) Cross-correlograms taken from the same laboratory by using identical techniques for easier comparison. Both are based on visually driven activity and involve a “shuffle correction” (43), and they are normalized against the firing level of the afferent, which is why some bins fall below zero. Both represent driver inputs and include another retinogeniculate pair (C) plus a geniculocortical pair (D). Note the difference in vertical scale, indicating that the retinal input accounts for more postsynaptic spikes in the geniculate cell (C) than does the geniculate input to the layer 4 cell of the striate cortex (D). Note also that the time represented by these cross-correlograms is much briefer than that for A and B. Nonetheless, both cross-correlograms have narrow peaks rising from a flat, low baseline, marking them as driver inputs. Data kindly provided by the authors for replotting. C is redrawn from data of Usrey et al.(15), and D is redrawn from Fig. 2 of Reid and Alonso (44).

